Traefik MCP SERVER
Your Agent Knows Your Gateway. Day 0 to Day 2.
The Traefik MCP Server gives an AI agent what's valid, what's running, and what's happening at your gateway: its schema, its live configuration, and the telemetry in Datadog, Grafana Cloud, or Dash0. It works from Day 0 to Day 2, in any MCP client your engineers already use.


TRAEFIK LABS IS TRUSTED BY LEADING ENTERPRISES WORLDWIDE


















The Challenge
Every Gateway Question Needs Data That Lives in Two Places
Deploying a gateway takes an afternoon. Running it takes years. On Day 0, teams write configuration the running release must accept. On Day 1, they prove who can reach what. On Day 2, which lasts years, they find out why traffic went where it did and change configuration without causing the next incident. Every one of those steps needs telemetry and configuration read together, and today they live apart.
What You Have
Two Halves of the Answer
What happened: traces, metrics and logs in Datadog, Grafana Cloud, or Dash0
Why the gateway did it: routes, priorities, middlewares, keys, and plans, inside the gateway
Your agent already reads the telemetry
For simple problems, that is enough
Configuration never reaches a telemetry backend
The Missing Piece
One Solution for Joining Both Halves
An agent limited to telemetry can describe an incident but not explain it, because the half that explains it lives in the gateway. Without joining telemetry with configuration, these questions are still unanswered.
Which route took this request, and why?
Which keys and routes exist that nobody has used?
Will this configuration work on the release we run?

The Solution
Read. Join. Validate.
The Traefik MCP Server is a read-only Model Context Protocol server. It gives the agent the gateway's own view, joined with the telemetry the team already collects, and checks every change the agent writes against Traefik's own schema.
Read What Exists
Routers, services, middlewares, health checks, and certificates from the running Traefik Proxy or Traefik Hub gateway, plus APIs, plans, and applications on Traefik Hub API Management.
- list_routers
- get_middleware
- get_service_health
Join It with What Happened
Traces, metrics, and access logs from the Datadog, Grafana Cloud, or Dash0 store the team runs, each matched to the router, middleware, or service that produced it. The agent never has to guess which configuration a trace is talking about.
- search_traces
- query_metrics
- query_access_logs
Validate Before Anyone Ships
The schema for every Traefik Proxy and Traefik Hub concept ships inside the server, version-matched to your release. The agent works from that definition rather than from older documentation and validates every configuration it writes before showing it. Day 0 and air-gapped ready.
- get_traefik_schema
- validate_traefik_config

Together, you get what happened and why in one answer.

The Architecture
One Server Between Your Agent, Your Gateway and Your Telemetry
The server runs beside the agent on a laptop, or as a sidecar behind the Traefik Hub MCP Gateway, which authenticates each caller and authorizes each tool. It reads the gateway through the Traefik API and the telemetry through the store's own API; the schema is bundled in the binary. Nothing is written, credentials are redacted before the model sees them, and the license is verified offline.
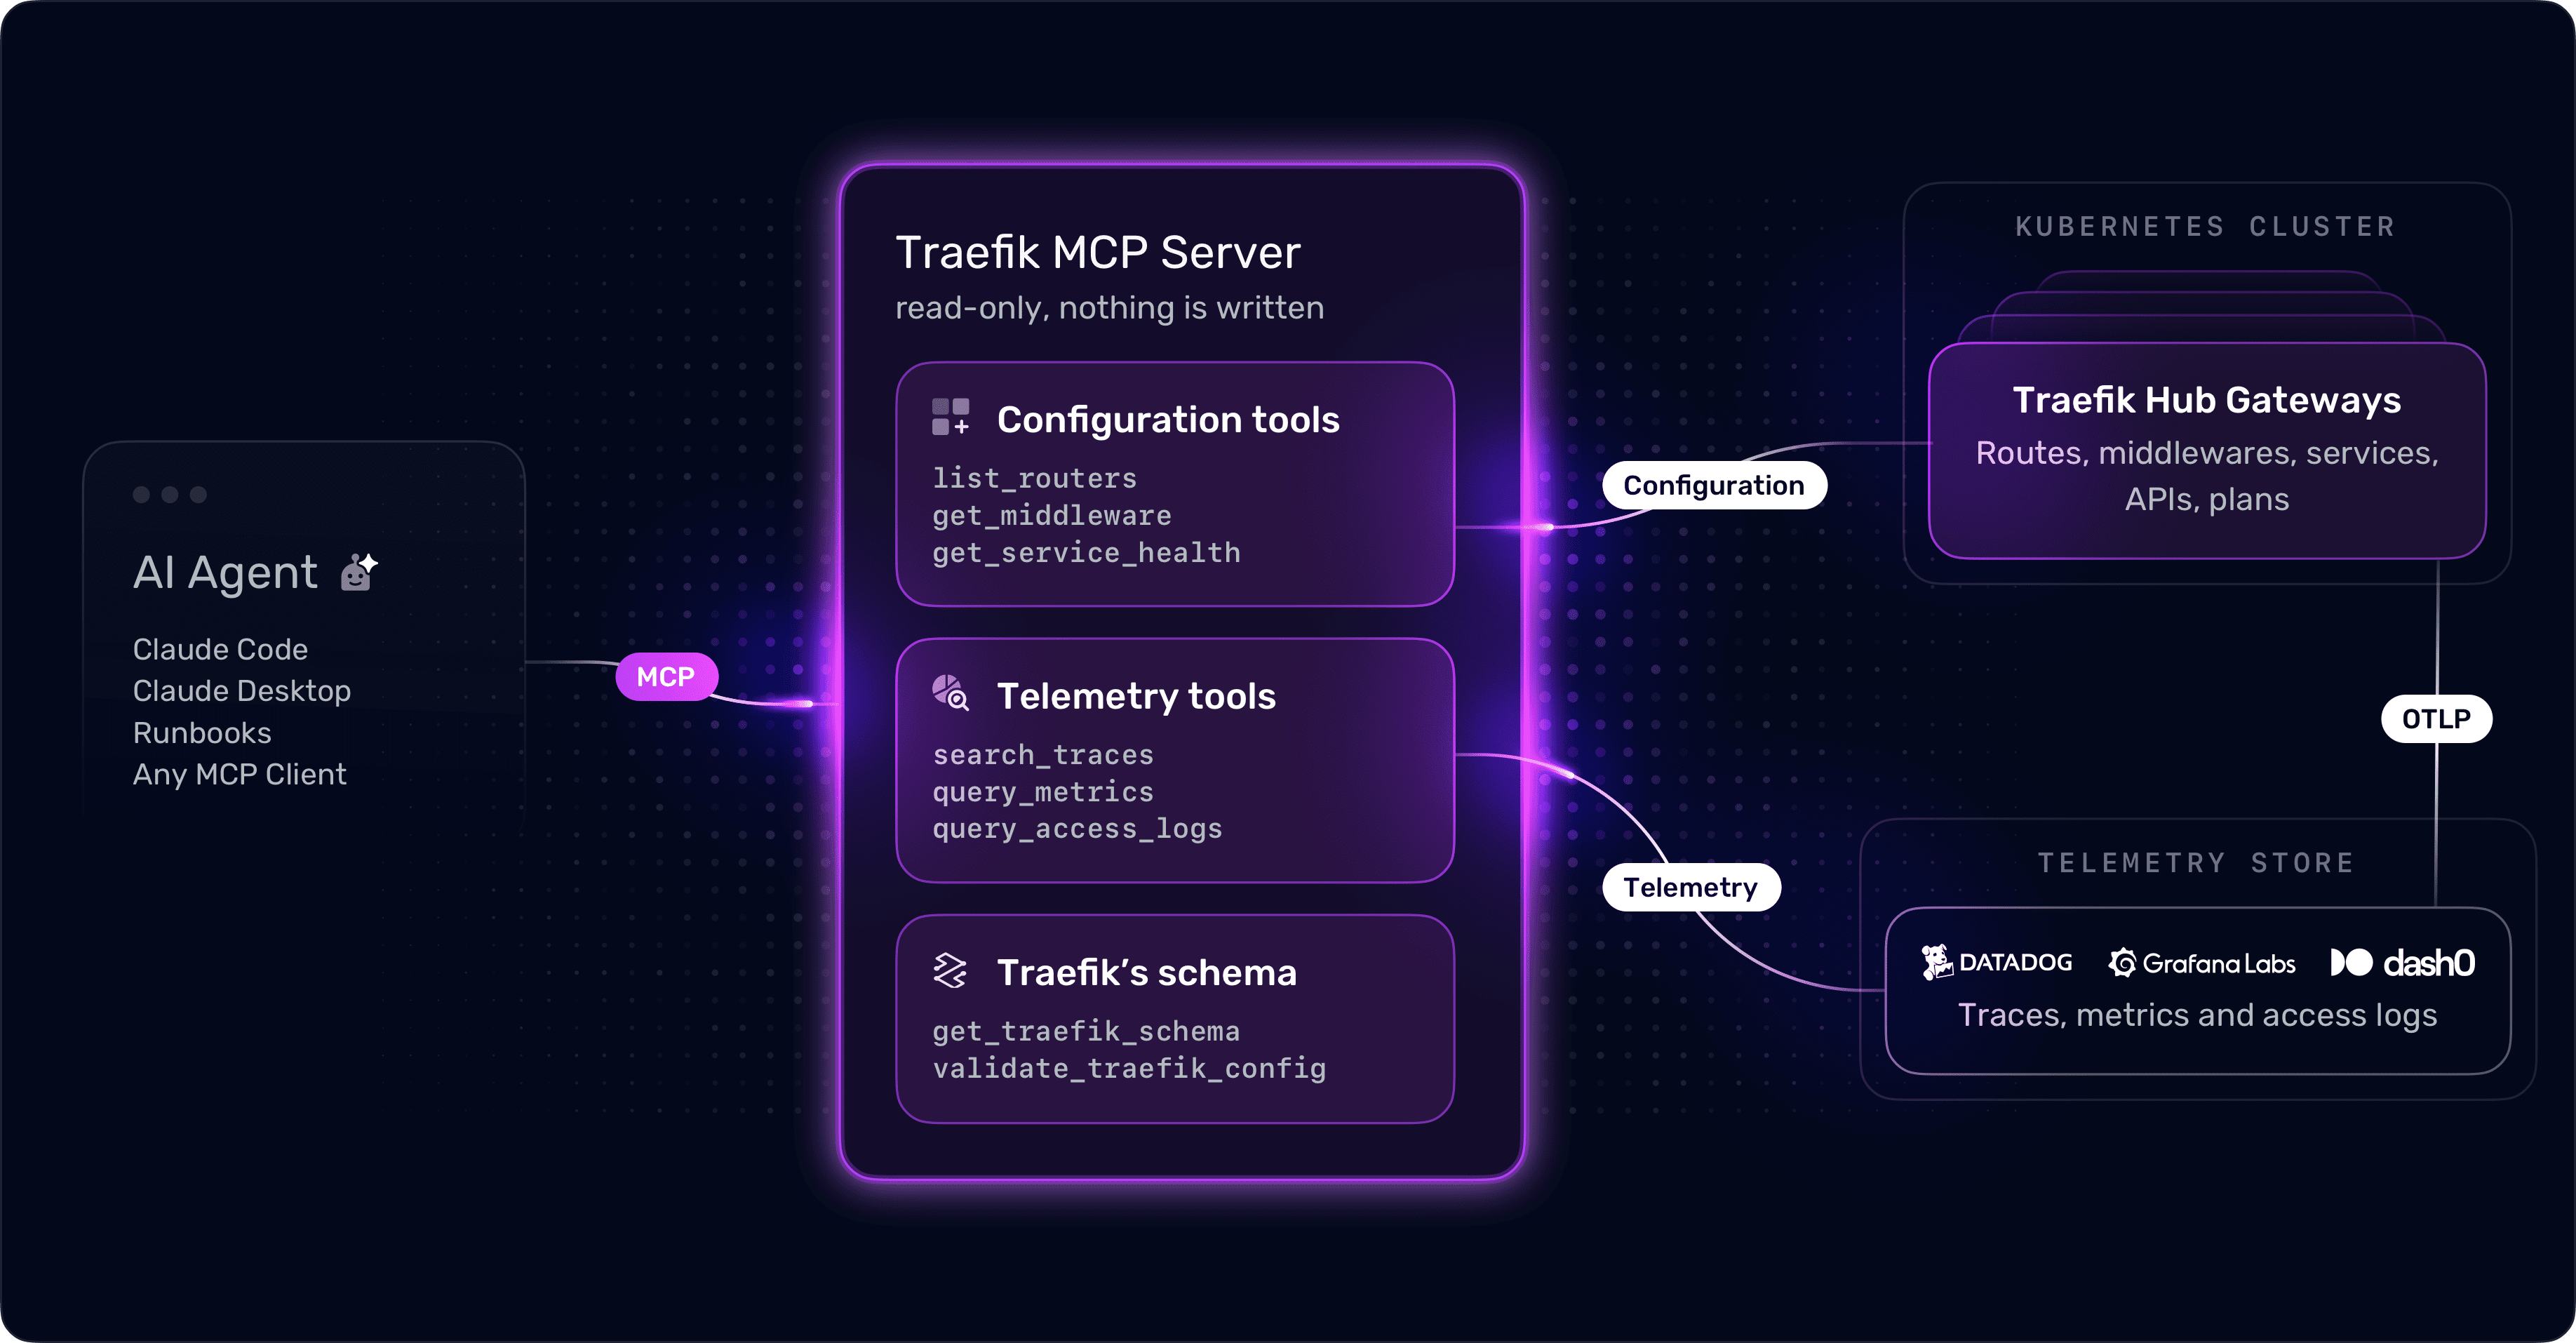
The Traefik MCP Server sits between the agent and two data sources: the Traefik Hub gateways, which supply configuration, and a telemetry store, which can be Datadog, Grafana Cloud, or Dash0. The agent reaches the server over stdio when the two run side by side, or through the Traefik Hub MCP Gateway when the server runs as a sidecar in the Traefik pod.
How It Works
What Your Agent Does Now
Below are four jobs from Day 0 to Day 2. On Day 0 nothing is running yet, so the agent checks its configuration against Traefik's schema. From Day 1, it joins the configuration with what the telemetry shows. Either source alone looks fine; the answer is where they meet.
00 | THE MIGRATION · DAY 0
Which Annotations Survive the Move?
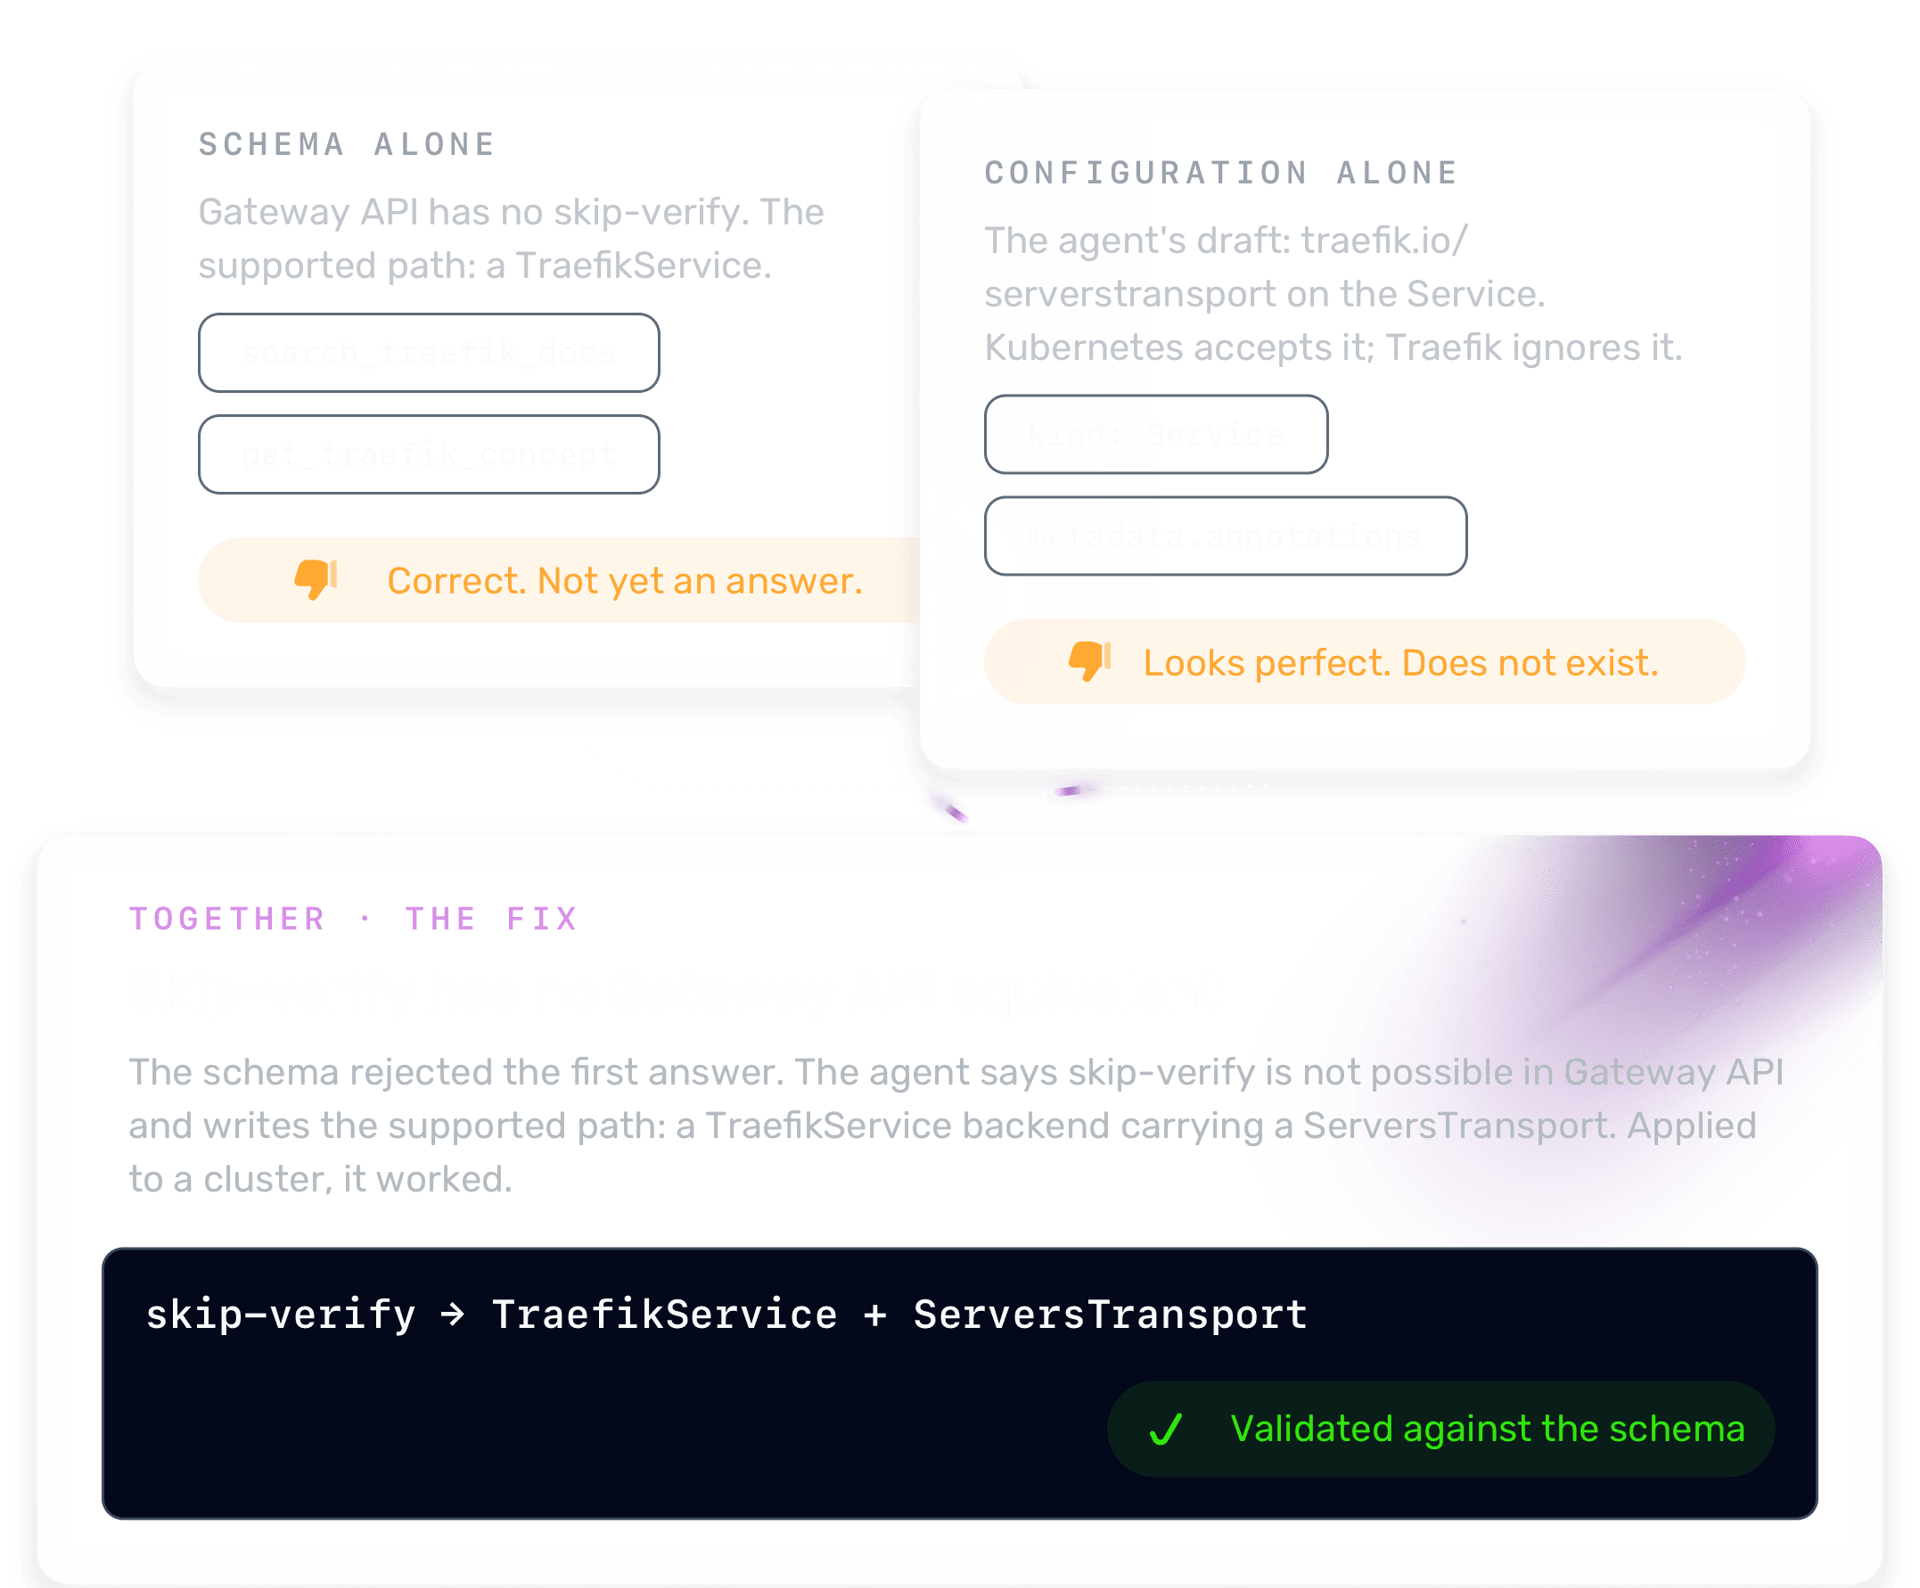
A team moves from NGINX to Gateway API on Traefik and asks the agent to translate three annotations, one of which turns off backend certificate checks. Gateway API has no such option. From memory, the agent invents one that looks perfect and fails silently.
TraefikService: the path Traefik supports
skip-verify: not in Gateway API, said plainly
Validated, then applied: it worked
01 | The Access Review · Day 1
What Exists That Nobody Has Used?
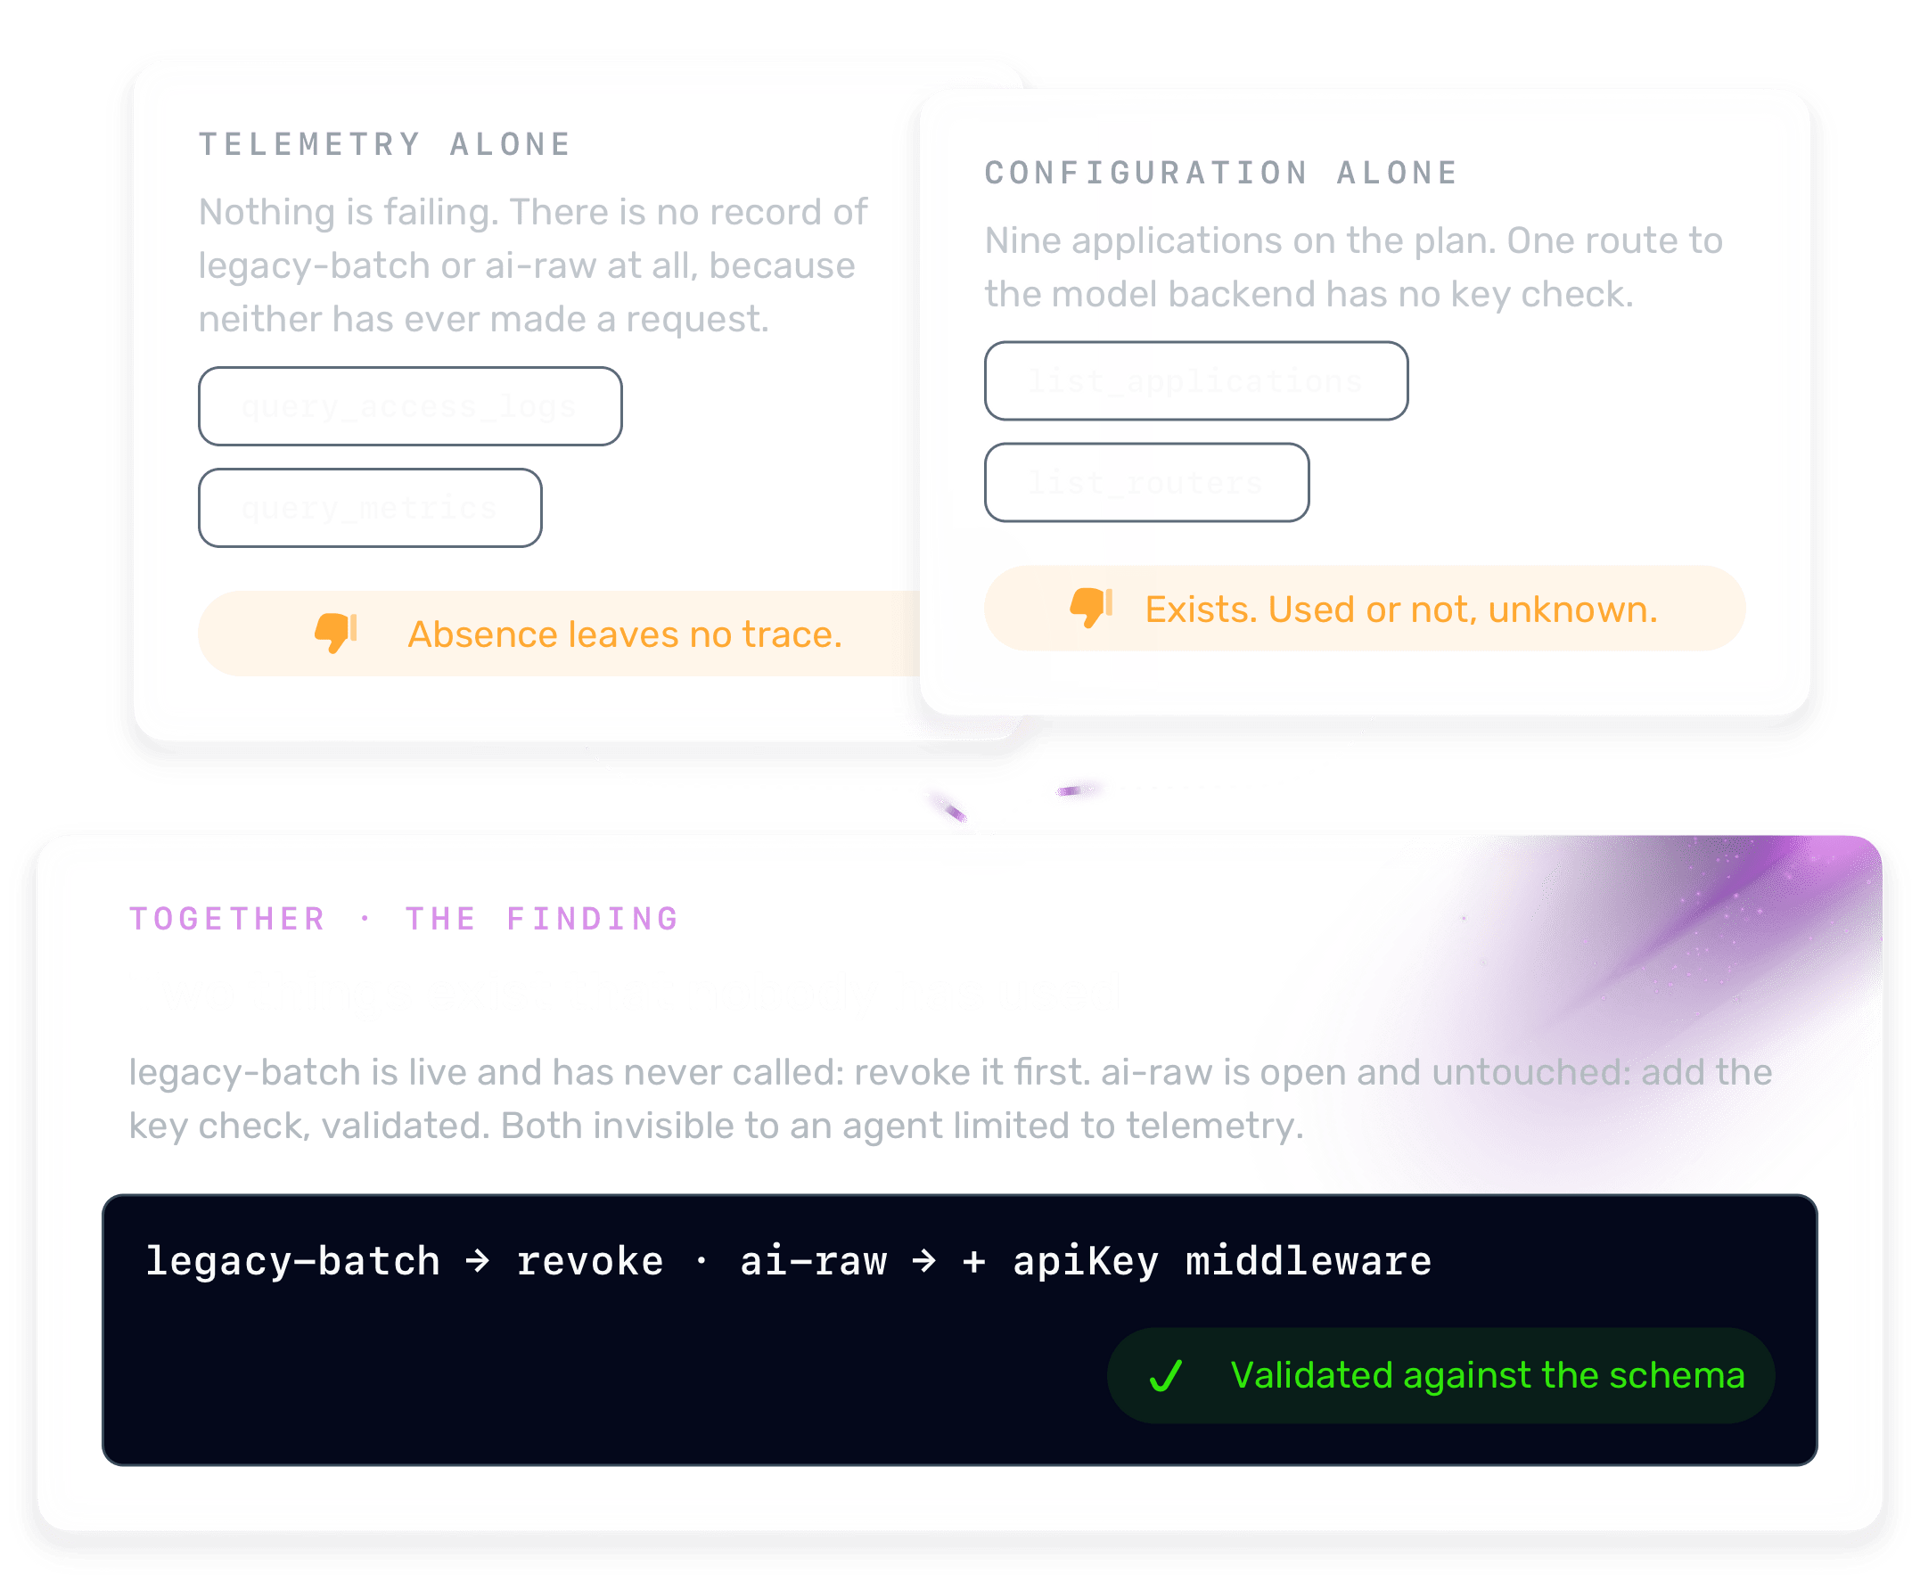
Nothing is failing and the quarterly review is due. A key that has never made a request leaves no trace in any backend, and neither does a route nobody has hit. The agent lists what exists in the configuration and subtracts what the telemetry shows was used.
legacy-batch: live, zero calls. Revoke first
ai-raw: a route to the model backend with no key check and no traffic
The finding is configuration minus telemetry
02 | The AI Spend Review · Day 1 and 2
Which Routes Reach the Model With No Limit?
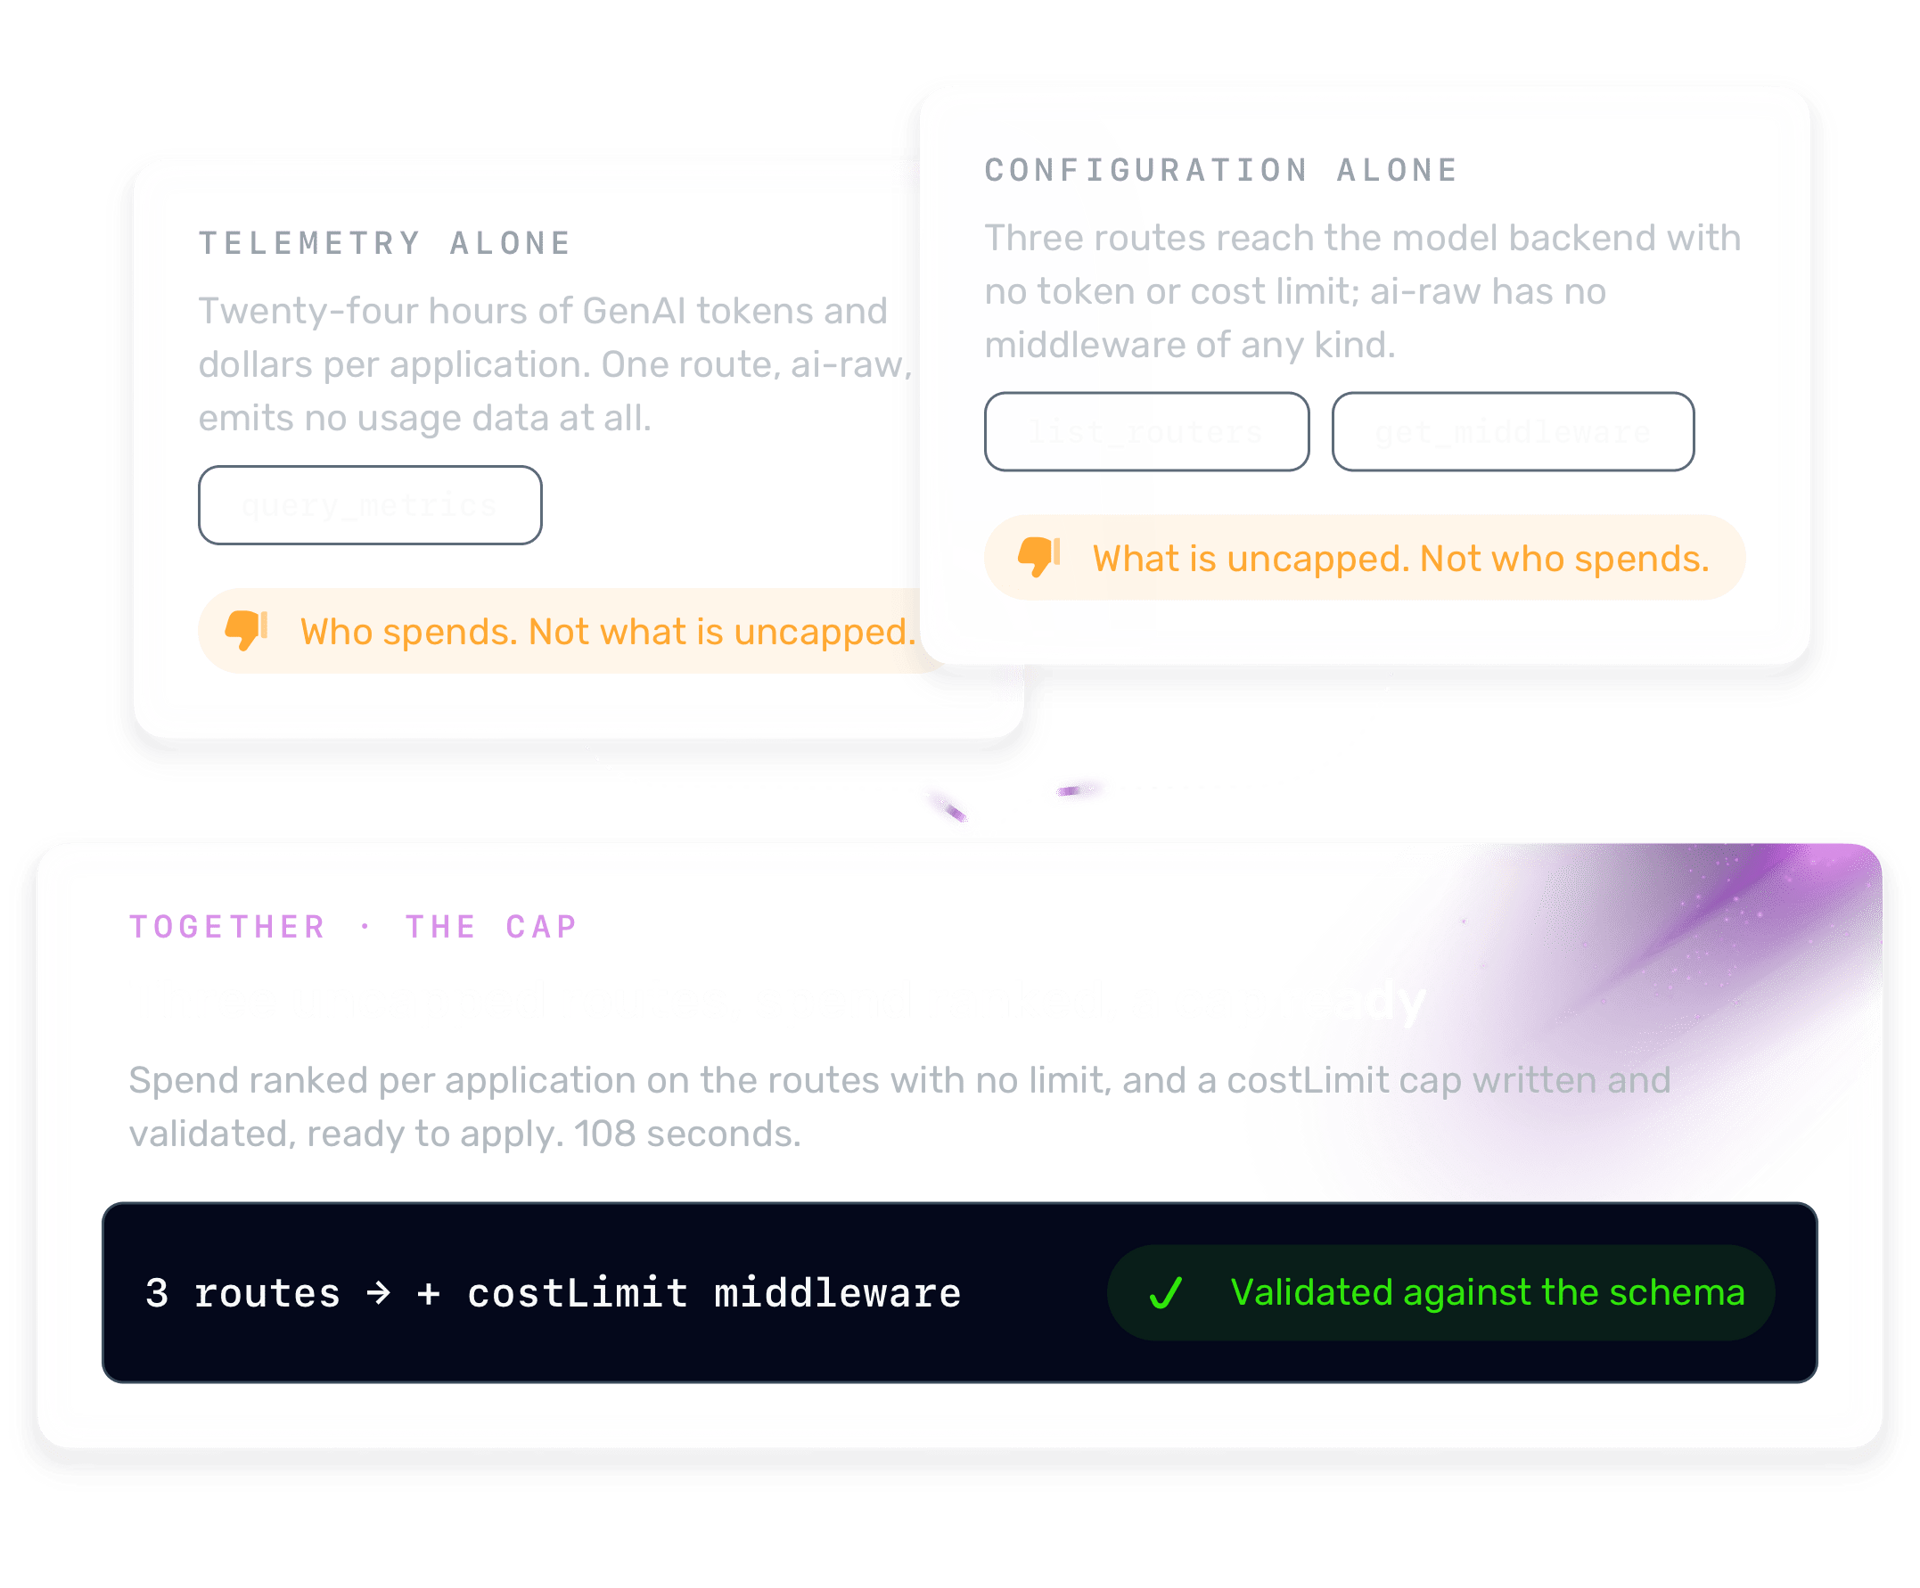
Which routes reach the model backend with no token or cost limit, and who is spending on them? The agent reads the routes and their middlewares, then the GenAI usage per application in the telemetry, and writes a cap it has already validated.
Three routes with no limit; one emits no usage data at all
Tokens and dollars per application, ranked
A validated cost cap, ready to apply
03 | The Rollout · Day 2
Why Does /v2 Return 404?
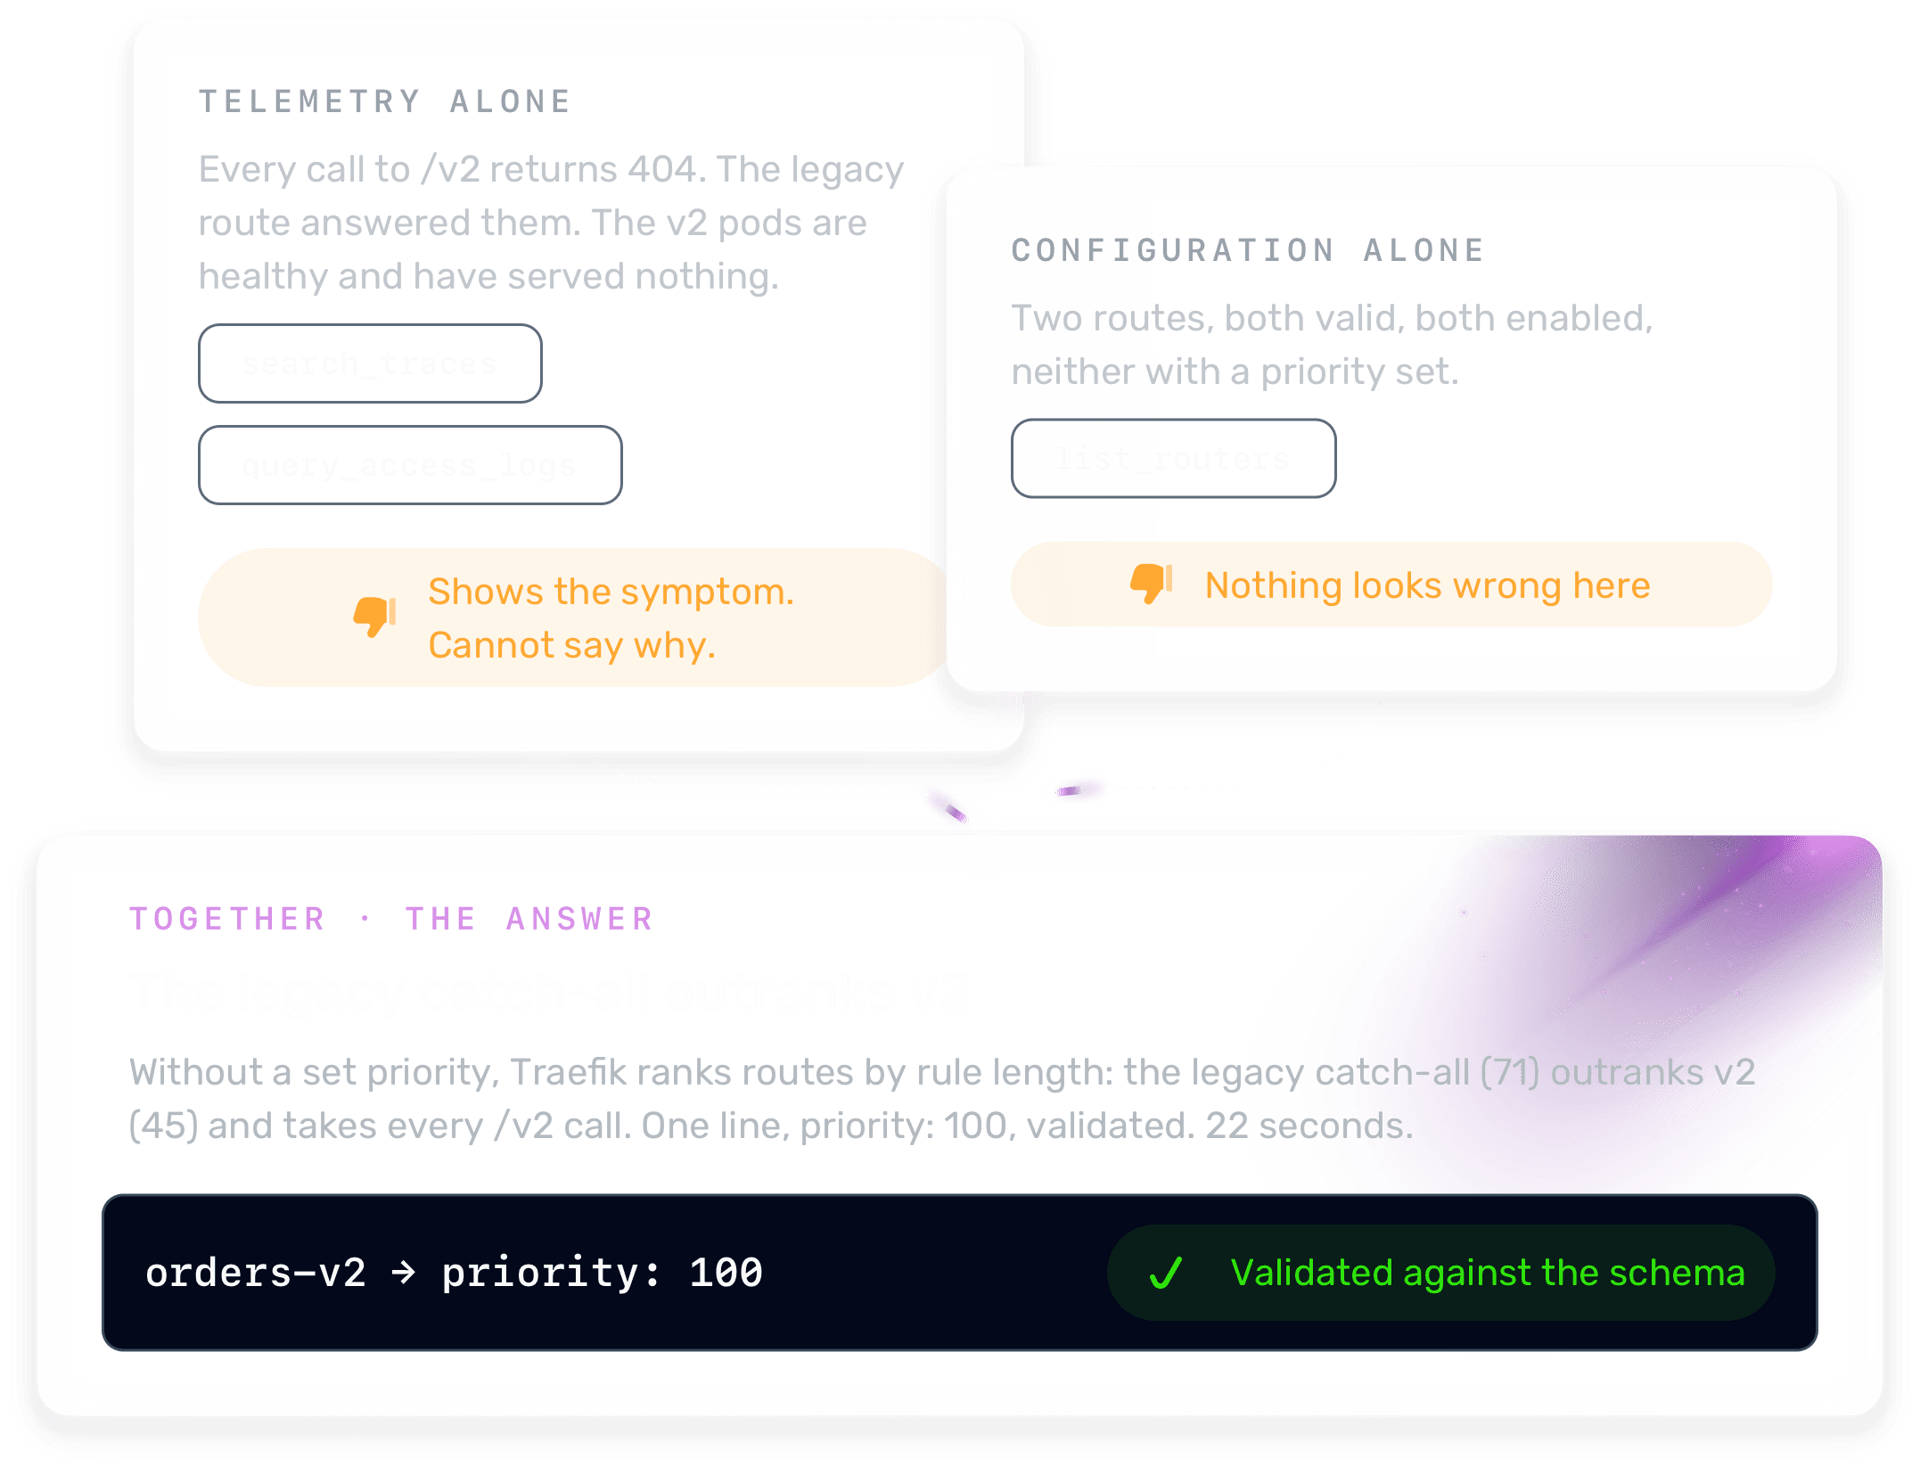
A team rolls out “Orders v2.” Calls to /v2 return 404 while the v2 pods are healthy. Telemetry shows the legacy route answering; it cannot show why. The agent reads both routes and their priorities: without a set priority, Traefik ranks routes by rule length, so the legacy catch-all (71) outranks v2 (45).
A one-line fix: priority: 100
Validated against the schema before it is shown
Works on the telemetry most teams already ship
FAQs
Frequently Asked Questions
They are complementary. A telemetry store's server answers questions about the data it holds. The Traefik MCP Server adds what the store cannot know: which router, middleware or service produced each span, and the configuration of the gateway that decided it. It queries the store directly, so the agent receives one joined answer.
What Users Have to Say