Grounded, Not Guessing: Inside the Traefik MCP Server

Today we released the Traefik MCP Server. It gives any AI agent a live, read-only view of your Traefik Proxy or Traefik Hub gateway, joined with the traces, metrics, and logs you already keep in Datadog, Grafana, or Dash0.
MCP servers are quickly becoming table stakes for infrastructure vendors, and many are thin wrappers around an existing API. Wiring an agent to your infrastructure is easy. Making it right is the hard part, and "mostly right" is the most dangerous place to be: a wrong answer that looks wrong gets ignored; a wrong answer that looks right gets applied.
So this post skips the feature list and focuses on the two engineering decisions that make it powerful and reliable enough to put in front of a production gateway: give the agent every source of truth at once, and ground everything it says in Traefik's own schema.
What an agent can do with it, from Day 0 to Day 2
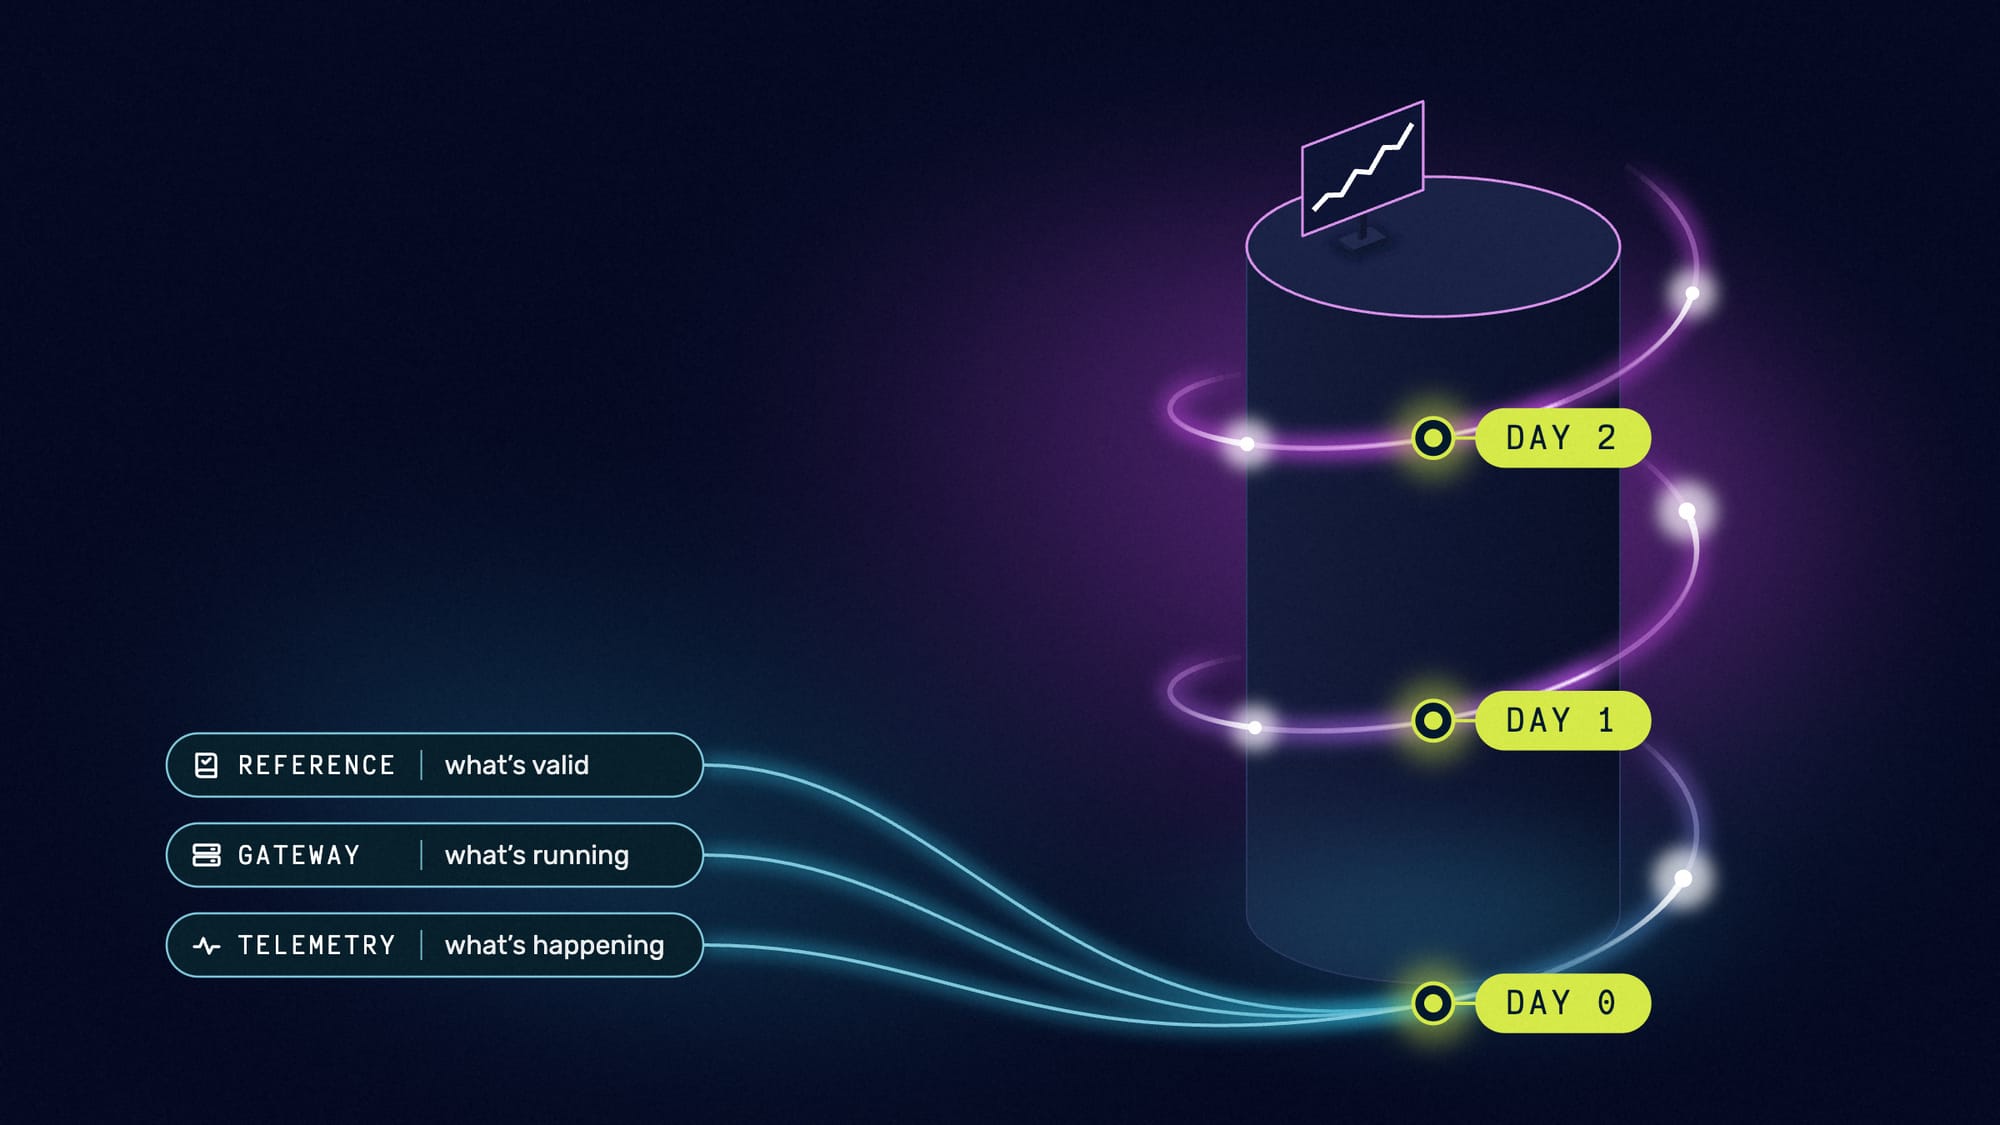
A gateway's life does not start at the first incident. The server is built for the whole lifecycle.
Day 0, setting up. Write a new IngressRoute, migrate NGINX annotations, configure a rate limit or a JWT middleware, and get configuration that is validated against the exact Traefik or Traefik Hub version you run, before you see it. Check that your observability is wired correctly: which metric families this deployment should emit, which ones actually reach your backend, and why the others do not. Generate a Grafana or Datadog dashboard built on the series your gateway really emits, with the names your backend really uses.
Day 1, going live. Prove who can reach what. Which routes have no authentication? Which API keys exist that nobody has used? Which AI routes let a caller pick its own model, and which guard or token budget stands in front of each one?
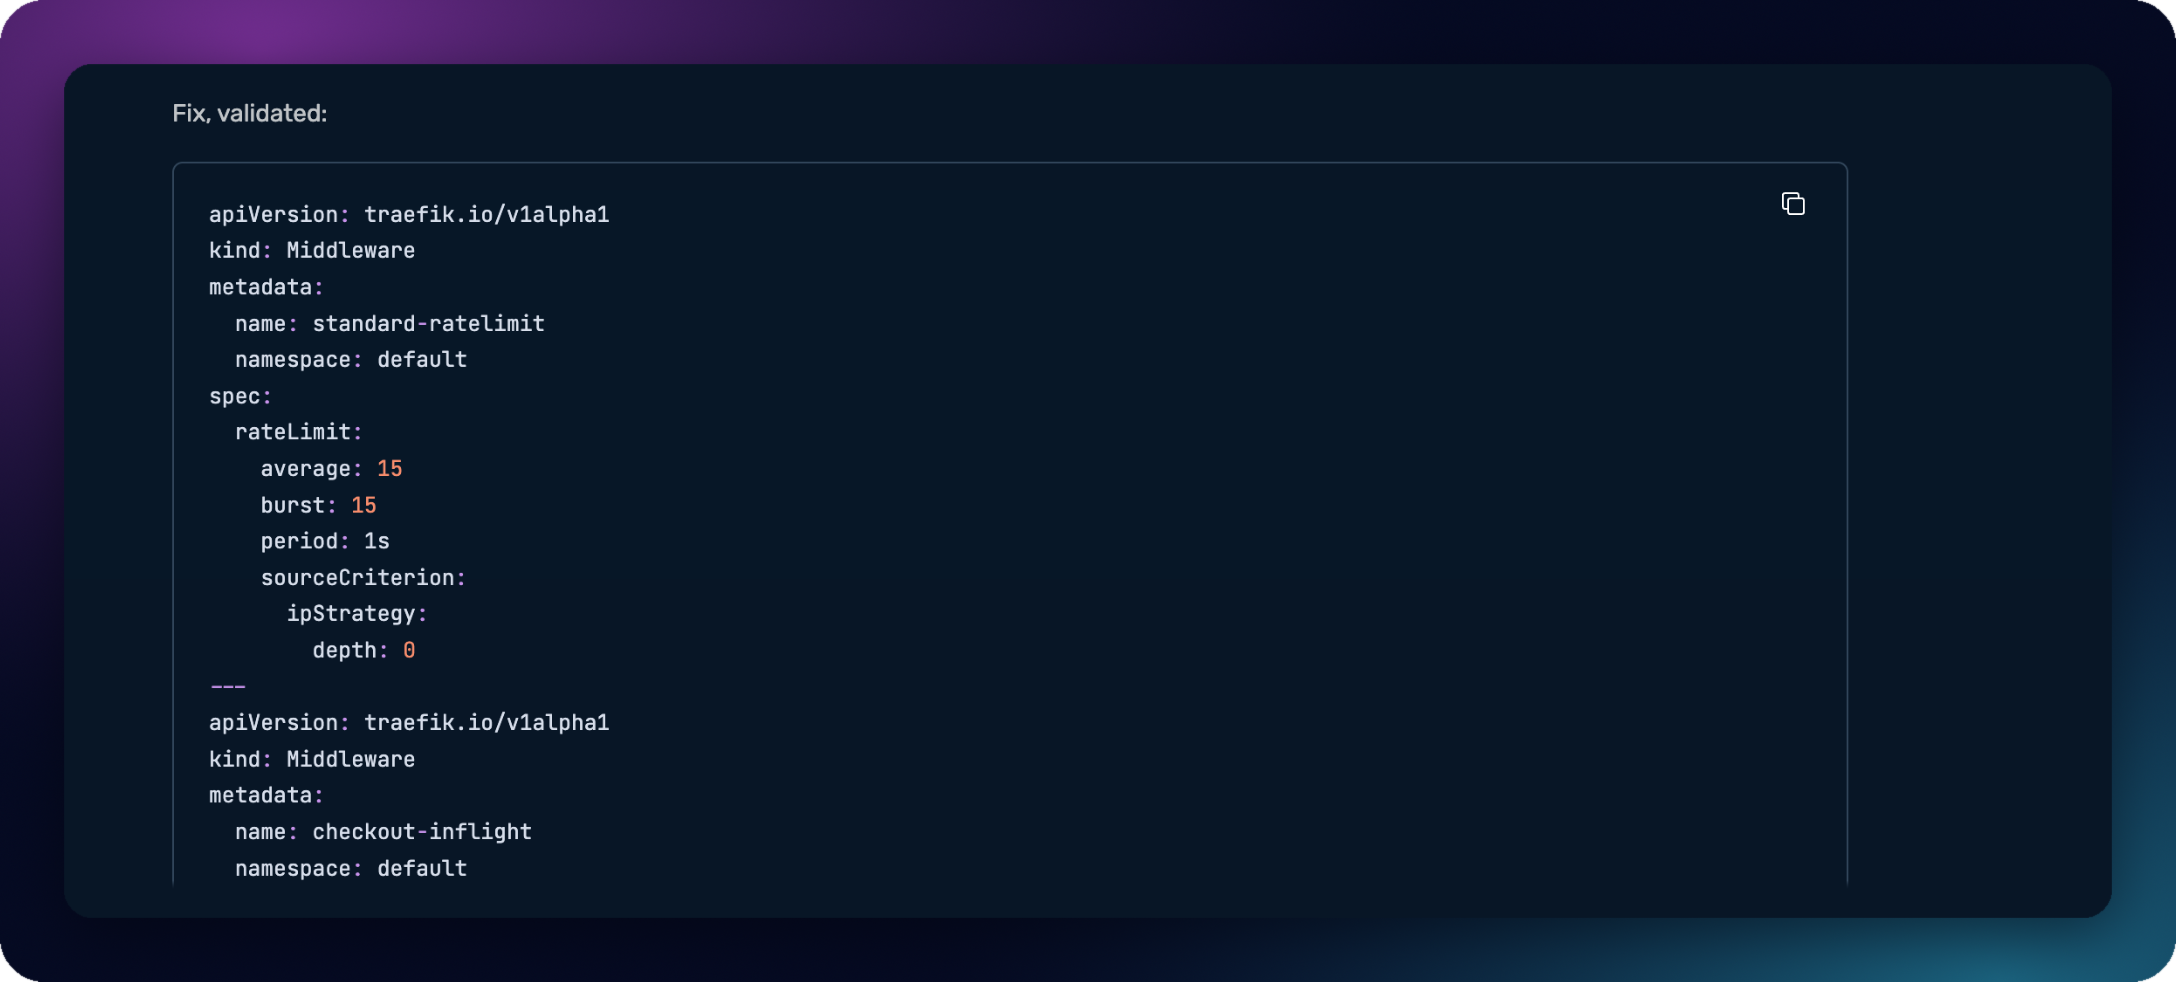
Day 2, running it for years. Explain what happened and why. Why this request took that route. Why a rate limit never fired. Why one incoming request turned into 14 calls to an expensive model. What to change, as a middleware validated against the running version.
None of these questions can be answered from telemetry alone. Most of them cannot be answered from configuration alone either. That is the first design decision.
Principle 1: The more sources, the sharper the answer
Your observability platform records what the traffic did and when. Your gateway knows what is exposed, to whom, and how it is protected. Those are two halves of the same picture, and today they live in two different tools.
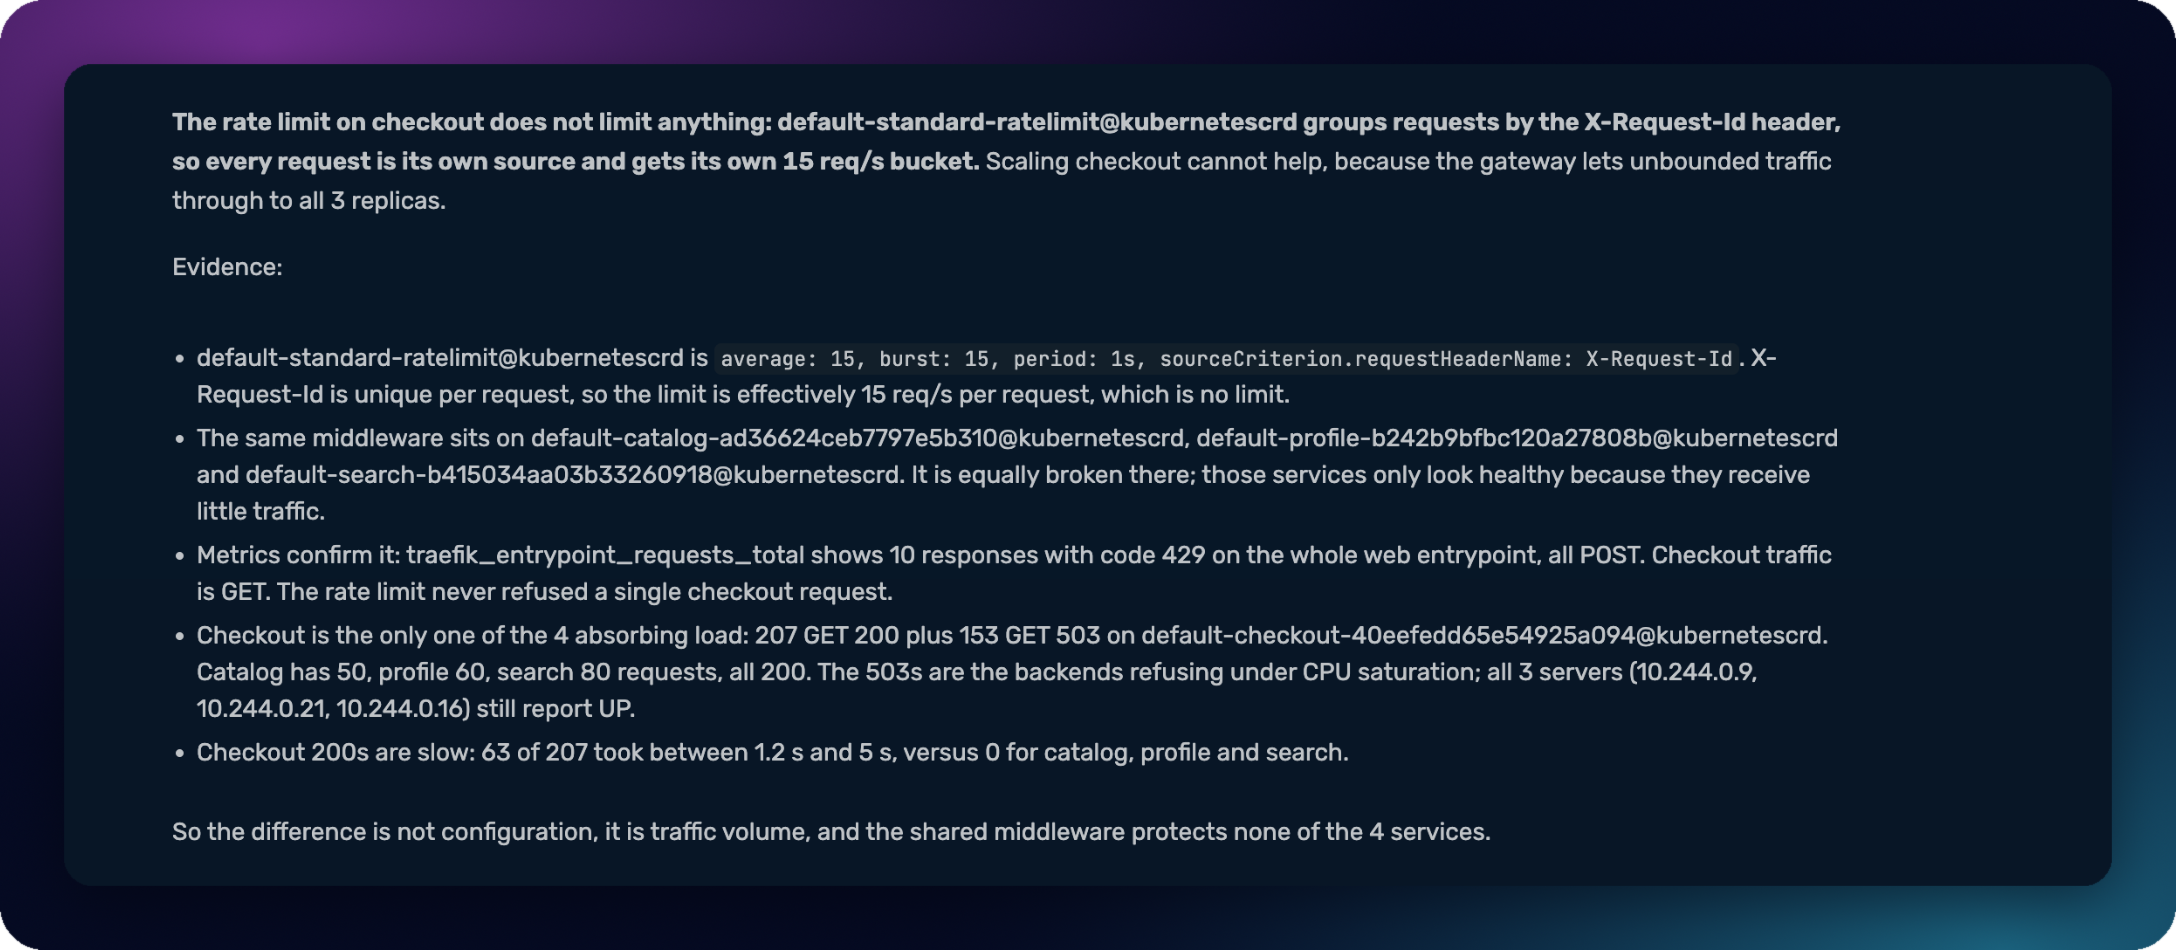
The hard problems are in the configuration, and configuration never reaches a telemetry backend, because it is not an event. Take a rate limit keyed on a request header that is unique per request. Every call gets its own fresh bucket, nothing is ever throttled, and the dashboards show zero 429s. A rate limit that has never fired and a rate limit that cannot fire produce exactly the same telemetry: none. You can stare at metrics for a week and never find it. One look at the middleware definition next to the metric, and it is obvious.
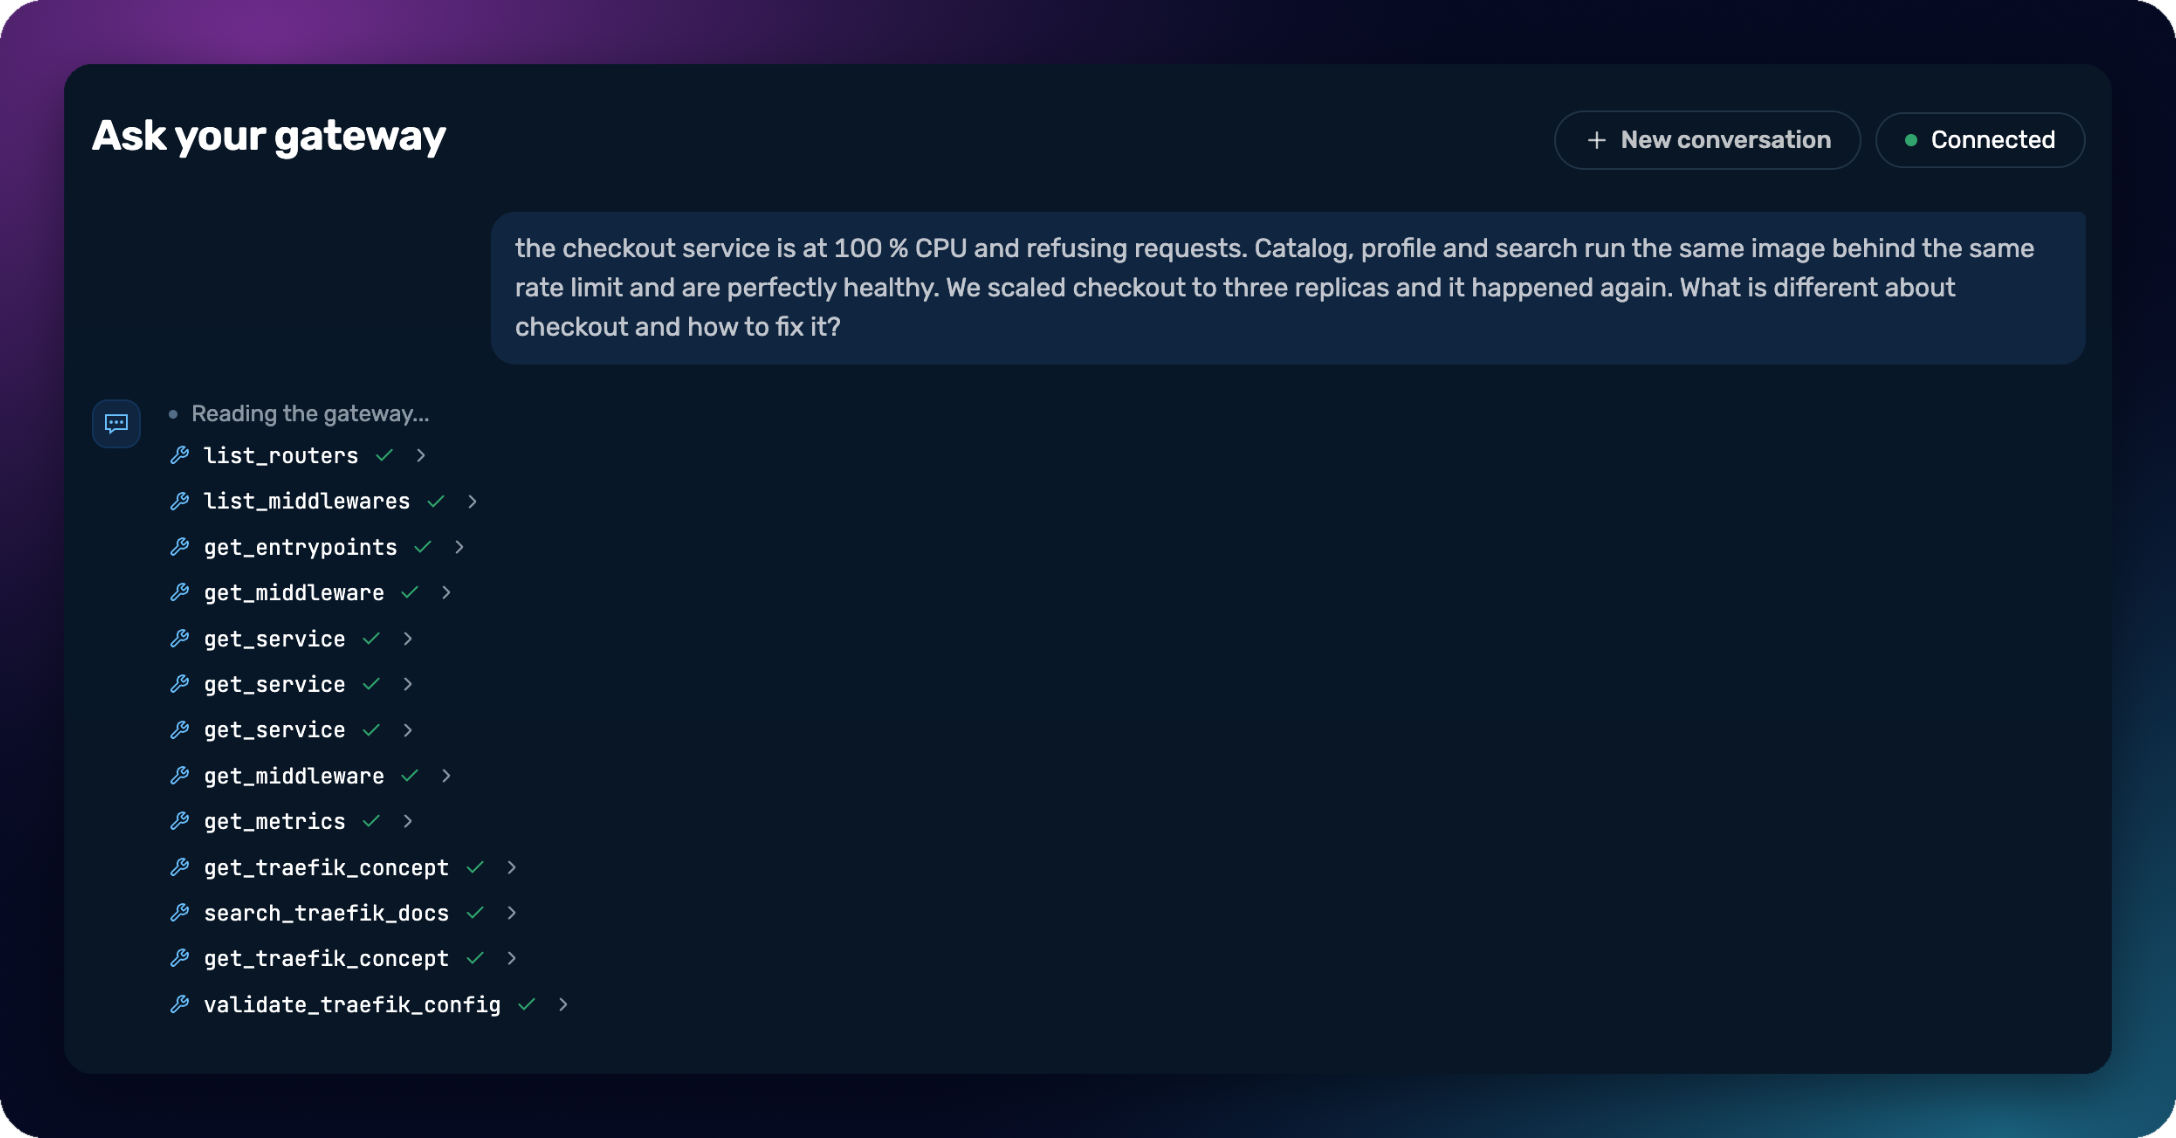
So we made the server read three kinds of truth, and made it able to join them:
- Telemetry: what happened. Traces, metrics, and access logs from Datadog, the Grafana stack (Prometheus, Tempo, Loki), or Dash0, each matched to the router, middleware, or service that produced it.
- Gateway: why it happened. The live state of the running gateway, read from its API on every call: routers, services, middlewares, certificates, the static configuration that decides which telemetry can exist at all, and, with Traefik Hub, the APIs, plans, applications, AI routes, guards, and quotas in front of them. Not from a manifest: a manifest tells you what somebody applied, the gateway tells you what it accepted, and those are not always the same thing.
- Reference: how to fix it. A machine-readable schema of every Traefik and Traefik Hub concept at the version you run, so the change the agent proposes is validated before you see it. More on this below.
That order is the order of an incident: what happened, why, how to fix it. On Day 0 the same three read backwards: the Reference writes a valid configuration, the gateway shows what it accepted, the telemetry confirms the data flows. The sources stay the same; only the direction changes.
Each source on its own reports what it sees; joined, they explain. A slow span becomes a named middleware in a configuration the agent can also fix. A cost spike becomes a route that allows a model override and has no token ceiling.
Joining also unlocks a kind of reasoning that no observability platform can do: reasoning about what is missing. A credential nobody uses emits nothing, and nothing is not a value. No query over telemetry can name the API key that was never used, because it is not in the data. To ask who is missing, you need the list of who should be there, and that list lives in the gateway. Same for a route with no guard, a metric family that was never enabled, a control that has never acted.
More evidence also means less room for invention. An agent with only half the picture fills the other half with a plausible story. An agent with both halves does not need to. And because evidence is only useful if it is honest, every telemetry answer from the server names the backend, the time window and the filters it used. An empty result says whether the store held nothing, or whether the filters excluded everything. In practice, this is what makes the agent say what it cannot prove: "seven days of data is not a quarter", "request headers are not recorded in the access log, so this cannot be checked". That sentence is worth more than any confident answer.
Principle 2: Grounding, or how to stop an agent from being plausibly wrong
Data gets the agent to the right question. Grounding keeps its answer true.
We need to be precise about what a hallucination is in infrastructure. It is rarely an invention out of nothing. It is a correct generalization, applied with confidence to a system that is one version and one deployment away from it. The model knows what a rate limit does, what the field is usually called, what a metric is usually named. Each of those can be right in general and wrong about the gateway in front of you. Nothing in a normal agent loop can tell the two apart, because producing a plausible answer is exactly what a model is built to do.
Traefik Labs Reference
We did not embed the documentation and retrieve the closest chunks: field names, types, defaults, and enums must be exact, and a near miss gets applied. So we built a dedicated project, the Traefik Labs Reference: a machine-readable catalog of every concept that shapes a Traefik configuration, generated from the source code of Traefik Proxy and Traefik Hub at a pinned release. Nobody writes it by hand. It covers routers, services, every middleware with its fields and defaults, TLS, providers, CRDs, Kubernetes annotations, the static configuration, the API Management and AI Gateway resources, and the Gateway API. A CI regenerates it each time a new stable release ships, and the MCP server embeds it, so it also works in air-gapped clusters.
For each concept, the Reference ships three things, and each one solves a different problem.
A structured page, for fast discovery. One concept per file, with a frontmatter that is a strict contract: fields, types, defaults, where the concept applies. A compact index of the whole Traefik and Hub surface fits in about 10,000 tokens. The agent reads the map once, then pulls only the pages it needs. It understands your gateway's vocabulary in seconds, instead of searching blind.
A JSON Schema, for formal validation. Every configuration the agent writes, whether a static file, a dynamic file, a CRD, a Gateway API resource or an annotated Kubernetes manifest, is checked against the schema of the version you run. And this is not a suggestion: the server's instructions forbid the agent to show any configuration it has not passed through validation. Grounding does not make the model smarter. It makes a wrong guess impossible to hide. The field does not exist, the schema rejects it, the agent tries again. The error surfaces instead of being narrated.
A metrics catalog, for reading telemetry correctly. Every series Traefik and Traefik Hub emit, with the exact name it takes on each backend, its labels, and the option or feature that must be enabled for it to exist. This detail matters, because the OpenTelemetry export renames things on the way: a router named api@file becomes api_file in Datadog, counters arrive as per-interval deltas, a Prometheus reader sees _total suffixes the OTLP instrument never had. An agent that does not know this tells you a dimension is missing when it is simply spelled differently. Worse, it writes a query that returns nothing and concludes that nothing happened.
With and without grounding
One example, real, same model on both sides.
The annotation that does not exist. We took a migration question copied verbatim from the Traefik community forum: Three Ingress-NGINX annotations to move to a Gateway API HTTPRoute, one of them turning off backend certificate verification.
We ran the same model twice, with the same access to the forum thread. Without grounding, it got most of it right, then offered a workaround:
apiVersion: v1
kind: Service
metadata:
  name: my-backend
  annotations:
    traefik.io/serverstransport: my-ns-insecure-transport@kubernetescrd
That annotation does not exist. What makes it convincing is that serversTransport does: it is a real field, on a real resource, moved to a mechanism where it has no meaning. The prefix is right, the @kubernetescrd suffix is right, and it is borrowed from patterns that work elsewhere in Traefik. Kubernetes accepts it, Traefik ignores it, and the route is broken in production with no error message. This is what a hallucination looks like in infrastructure: not an invention, a correct concept applied one mechanism too far.
With grounding, the model read the Gateway provider's contract instead of recalling it. It said plainly that Gateway API has no field for skipping certificate verification, then pointed at the path Traefik does support: a TraefikService as the route's backend, carrying the scheme and a ServersTransport. 20 tool calls instead of 1, 2 minutes instead of 5 seconds, and a manifest it refused to show before the schema accepted it.
We applied that manifest to a cluster, and it just worked.
What it cannot do: the limits that make it safe
Capabilities get you a demo, and limits get you production.
It cannot change anything. Every tool reads. None writes. The agent proposes a middleware, validated against your version; a human applies it through the pipeline that already exists. No new write path to the gateway means no new way to break it, and no debate about which agent gets which permission. And what it reads, it redacts: every token, password, and key in a middleware definition comes back as a placeholder. The pointer to the Kubernetes Secret stays, because which Secret a middleware reads is what an audit needs, and the pointer is not the secret.
It cannot answer from memory. Nothing is cached. Every router, every middleware definition is fetched from the gateway at the moment of the question, and every answer carries a fingerprint of the configuration it was computed from. If the gateway changed since the last call, the agent is told to fetch again rather than reason on a picture that is no longer true.
It cannot offer a signal you do not have. The server reads the gateway's static configuration at startup and exposes only the tools this deployment can answer: no trace tool without a trace exporter, no API Management tool on a gateway that does not run it. At connect time it tells the agent which backends answer, in which query language, and which metric series can exist here. So when a series comes back empty, the agent knows whether that is silence or a disabled exporter, and it never queries a backend you do not run.
What this means for you
The bottleneck in AI operations is fragmented data and ungrounded answers, more than model quality. Telemetry says what happened. The gateway says why. The Reference says how to fix it, and whether that fix is valid for the version you run. Every question worth asking needs the first two, and every answer worth applying needs the third.
The Traefik MCP Server is available today on Docker Hub and GitHub Container Registry, unlocked with a Traefik Hub token licensed for the MCP Server. It reads both Traefik Proxy and Traefik Hub gateways, works with Datadog, Grafana and Dash0, and plugs into any MCP client your engineers already use. If you are at AGNTCon/MCPCon in San Jose this week, come to our booth with your hardest gateway question. We will run it live.
An assistant that is right about gateways is a demo. An assistant that is right about your gateway is a colleague.
Resources
- Traefik MCP Server landing page: https://traefik.io/solutions/traefik-mcp-server
- Traefik MCP Server documentation: https://doc.traefik.io/traefik-hub/ai-gateway/administration-ui/ask
- Container image on Docker Hub
- Traefik Hub
- Traefik Community Forum