How Traefik Labs Moved its Status Page and Monitoring to openstatus (and Contributed Back)

TL;DR
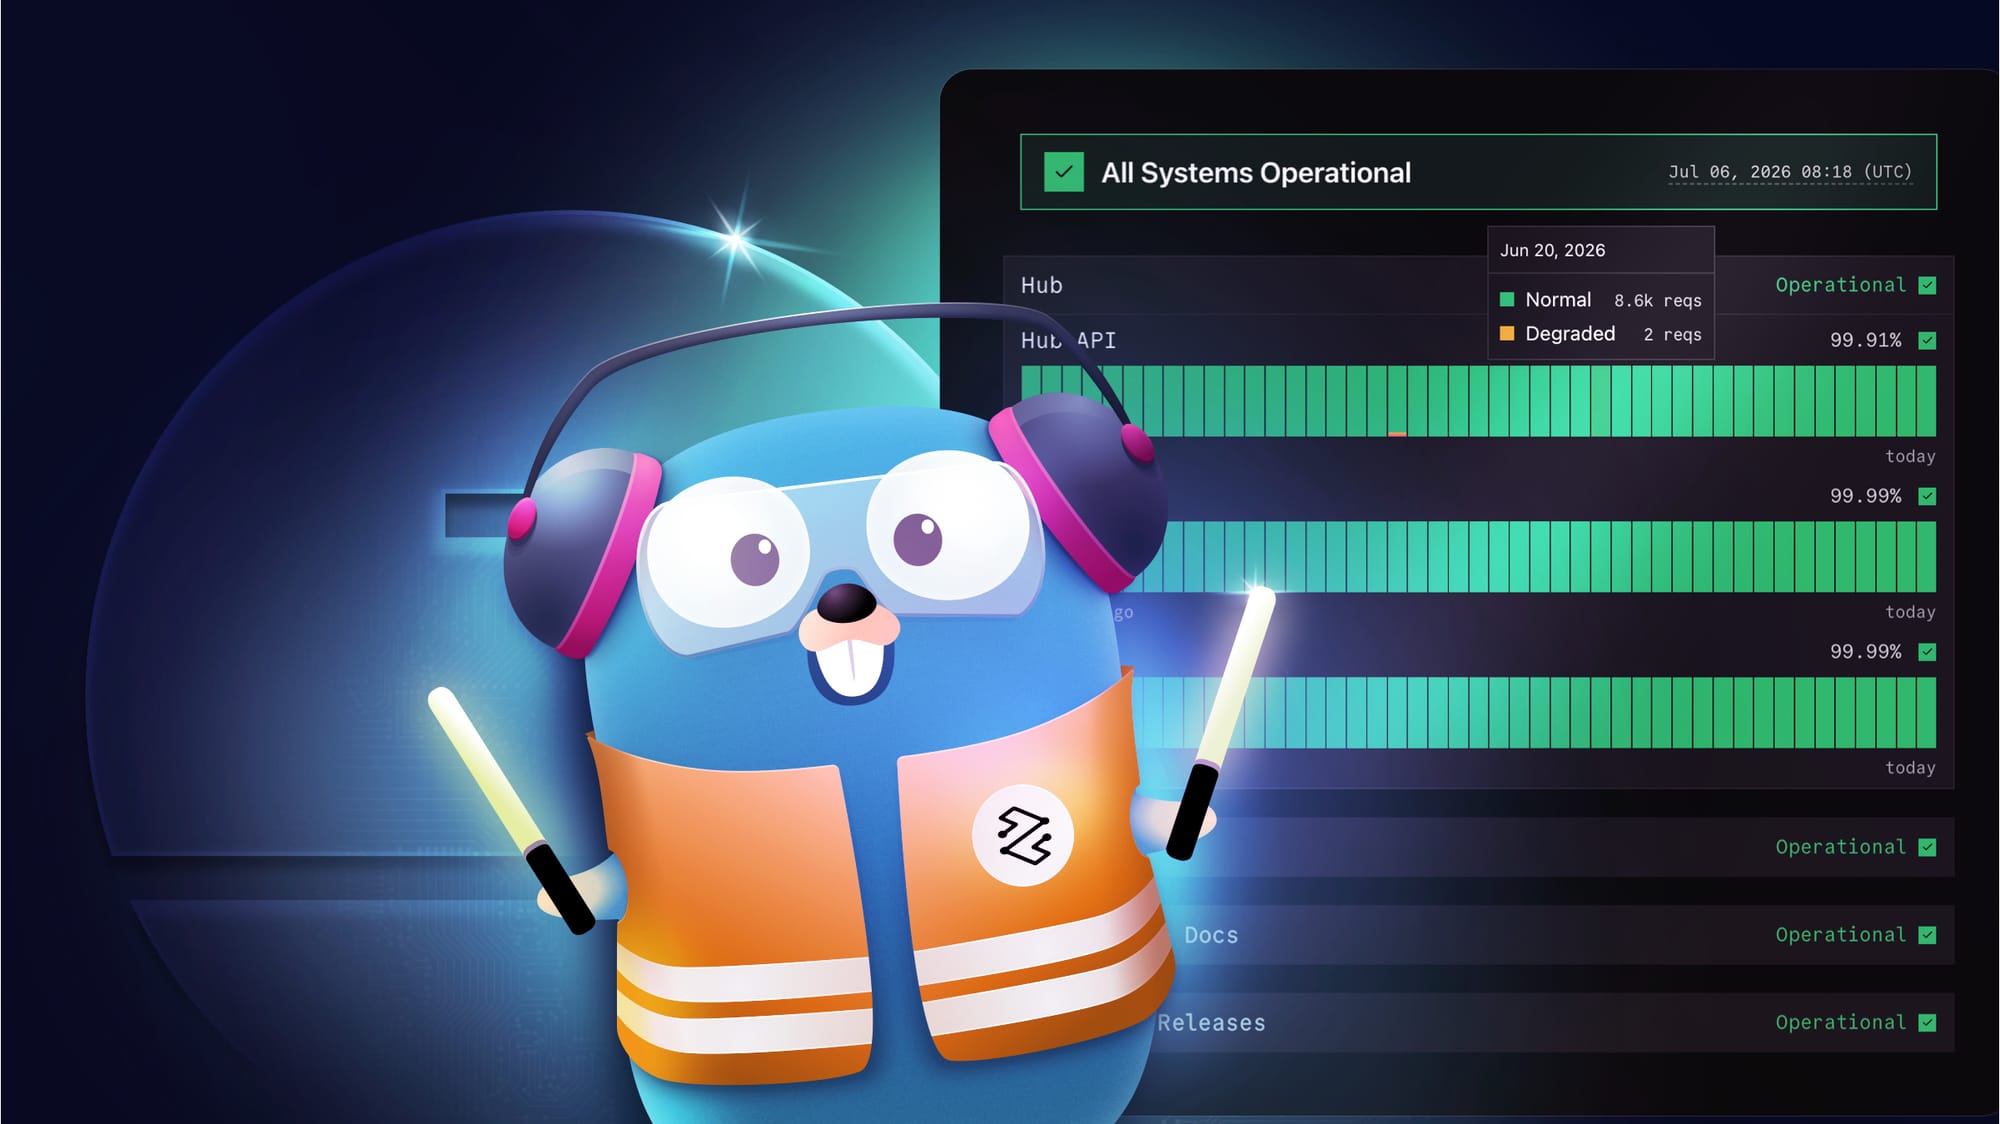
We replaced a self-hosted Cachet status page and Grafana Cloud Synthetic Monitoring with openstatus, an open-source monitoring and status-page platform. Along the way we hit gaps in openstatus's young Terraform provider, and instead of working around them we fixed them upstream. The result: a fully Infrastructure-as-Code status page, multi-region synthetic checks, Grafana IRM alerting, a Slack incident bot, and four merged PRs in the openstatus provider that everyone now benefits from. 🎉
Where We Started
Like many teams, we had accumulated a bit of 'tooling debt' over the years. Our status page (status.traefik.io) ran on Cachet, self-hosted on a GCP Compute Engine VM: a PostgreSQL data disk, S3 backups, SendGrid for email, and a preview environment. Essentially a small fleet of moving parts we had to patch, back up, and babysit.
The actual probing lived somewhere else entirely: Grafana Cloud Synthetic Monitoring, with k6 scripted checks fanning out from North Virginia and Frankfurt across our public services.
Two systems, two bills, and no single place able to answer the question "is this Traefik service up right now?" 🤷
The Trigger
In late 2024, Grafana Cloud changed its Synthetic Monitoring billing to a per-test-execution model. Our rough estimate: +$350/month. On top of the cost, the synthetic-monitoring UX was painful, and Grafana Cloud had no status page to offer at all.
To keep the bill in check, we'd had to bundle many URLs into custom k6 scripts so several endpoints shared a single test execution. It worked, but it traded money for complexity: scripts to write, maintain, and debug instead of plain declarative checks.
And there was still a blind spot we couldn't close. We were seeing intermittent performance issues we were not able to explain, and we couldn't tell whether they were real or just transient network noise, because running checks from multiple probes on Grafana Cloud was prohibitively expensive. We were effectively monitoring from a single vantage point and guessing.
So we ran a study with clear criteria:
- A complete technology, with summary views, subscriptions and worldwide probes
- Compatible with our LGTM/OTLP observability stack
- Open source, so we could self-host if we ever had to
- Reasonable price
We looked at openstatus, Betterstack, status.io, and Instatus.
Why openstatus
The shortlist came down to openstatus vs Instatus. Three things decided it:
- The redirect problem. Many of our endpoints are healthy precisely because they return a
307,401,302,301, or405— not a200. Instatus couldn't assert on a response without following redirects, which made our checks meaningless. openstatus could. - It fits our tooling. openstatus plugs straight into the stack we already run, including webhook alerts into Grafana OnCall / IRM, a Slack bot (with an
@openstatusAI agent for incidents and maintenance), plus an API and a CLI. No glue code, no parallel workflow. - It's open source. A first-class Terraform provider, and if the hosted offering ever stopped fitting, we could run it ourselves.
openstatus was the way to go.
The Migration
We didn't lift-and-shift. We took the opportunity to re-curate what we monitor and rebuild the whole thing as code:
- Monitors—all our public endpoints defined in Terraform, probed every 1–5 minutes from six regions, with retries before a check is declared down. Multi-region, affordably: we can finally tell a genuine outage apart from a transient internet error.
- Status page—
status.traefik.io, with components grouped into Hub / Plugins / Community & Docs / Updates & Releases, custom domain wired through Cloudflare. - Alerting—openstatus webhooks into Grafana OnCall / IRM, with Slack and web alert templates and escalation routing.
- Decommissioning—It felt great to finally simplify our stack, we tore down the Cachet VM and everything linked to it.
All of it lives in our GitOps repo and is applied through tofu-controller. No more snowflake VM.
The Collaboration: Fixing the Provider Together
openstatus's Terraform provider was young, and a real-world migration this size pushed on its edges fast. Rather than route around the rough spots, we worked with the openstatus team and contributed the fixes upstream:
Issues We Reported
- #8 add a follow_redirects attribute: the exact capability that had ruled out the alternative.
- #7 crash on nil optional fields (
timeout, degraded_after).
PRs We Merged Into the Provider
- #10 remove
omitemptyon bool fields and fixGetMonitorresponse parsing. - #11 add a
group_orderattribute to status-page components. - #12 add
icon,custom_domain,access_type,password, andauth_email_domainsto the status page. - #13 implement in-place Update for status pages.
And the openstatus team shipped fast in return: v0.2.1 added plan-time region validation, and v0.2.2 fixed an empty-header placeholder bug that broke our monitor applies. The provider that manages our status page today is, in part, the one we helped build.
What made this click wasn't just the tech; it was working directly with openstatus's two founders, Thibault Le Ouay Ducasse and Maximilian Kaske. We share a Slack channel with them: we propose features, report rough edges, and watch issues turn into merged PRs in days, not quarters.
At Traefik Labs we're a small team too, and we know exactly what makes that rhythm work—short feedback loops, no layers between the people with the problem and the people with the fix, and a shared bias toward shipping. Working well and delivering faster, together, that's the game changer. And it's exactly the kind of partnership we want around our infrastructure.
That's the part we want to highlight: open source turned a vendor migration into a collaboration. We got a status page and monitoring that fit our needs; the wider openstatus community got a more capable Terraform provider.
Where We Are Now
- One open-source platform for synthetic monitoring and the public status page
- Everything managed as code, reviewed in PRs, applied via GitOps
- Affordable multi-region probes. Real outages stand out from transient internet errors
- Grafana IRM alerting and a Slack incident bot
- Lower cost, fewer moving parts, no self-hosted VM to maintain
Get Involved
If you're dealing with similar monitoring headaches, we’d recommend giving openstatus a look. And don't be afraid to open a PR if you spot a gap. It's a great community to build with. Check them out on GitHub.
Thanks to Thibault and Maximilian for the responsiveness and the partnership. 💙