Distributed Tracing with Traefik and Jaeger on Kubernetes


Originally published: March 2021
Updated: December 2022
Hello, and welcome back to this blog series on Site Reliability Engineering and how Traefik Proxy can help supply the monitoring and visibility that are necessary to maintain application health.
In the first article, we discussed log analysis while the second covered Traefik metrics with Prometheus. In this article, we will explore another open source project, Jaeger, and how to perform distributed tracing for applications on Kubernetes.
- Part I: Log Aggregation in Kubernetes with Traefik Proxy
- Part II: Capture Traefik Metrics for Apps on Kubernetes with Prometheus
What is distributed tracing?
Debugging anomalies, bottlenecks, and performance issues is a challenge in distributed architectures, such as microservices. Each user request typically involves the collaboration of many services to deliver the intended outcome. Because traditional monitoring methods like application logs and metrics tend to target monolithic applications, they can fail to capture the full performance trail for every request.
Distributed Tracing, therefore, is an important profiling technique that complements log monitoring and metrics. It captures the transaction flow distributed across various application components and services involved in processing a user request. The captured data can then be visualized to show which component malfunctioned and caused an issue, such as an error or bottleneck.
This post demonstrates how to integrate Traefik Proxy with Jaeger, an open source end-to-end distributed tracing application that is also a Cloud Native Computing Foundation (CNCF) project. The integration captures traces for user requests across the various components of a hypothetical application running on a Kubernetes cluster.
Prerequisites
This post will walk you through the process of integrating Traefik Proxy and Jaeger, but you'll need to have a few things setup first:
- A Kubernetes cluster running at
localhost. The Traefik Labs team often uses k3d for this purpose, which creates a local cluster in Docker containers. However, k3d comes bundled with the latest version of k3s, andk3scomes packaged with Traefik ver 1.7, which you'll want to disable so you can use the latest version. The following command creates the cluster and exposes it on port 8081:
k3d cluster create dev -p "8081:80@loadbalancer" --k3s-arg "--no-deploy=traefik@server:*" - The
kubectlcommand-line tool, configured to point to your cluster. (If you created your cluster using K3d and the instructions above, this will already be done for you.) - A recent version of the Helm package manager for Kubernetes.
- The set of configuration files that accompany this article, which is available on GitHub:
git clone https://github.com/traefik-tech-blog/traefik-sre-tracing/
You do not need to have Traefik 2.x preinstalled, as you'll do that along the way.
Note: To keep this tutorial simple, everything is deployed on the default namespace and without any kind of protection on the Traefik dashboard. On production, you should use custom namespaces and implement access control for the dashboard.
Set up distributed tracing
First, you'll need to install and configure Jaeger on your Kubernetes cluster. The simplest way is to use the official Helm chart. As a first step, add the jaegertracing repository to your Helm repo list and update its contents:
helm repo add jaegertracing https://jaegertracing.github.io/helm-charts
helm repo update
The Jaeger repository provides two charts: jaeger and jaeger-operator. For the purpose of this tutorial, we deploy the jaeger-operator chart, which makes it easy to configure a minimal installation. To learn more about the Jaeger Operator for Kubernetes, consult the official documentation.
As it’s explained in the documentation, you’ll need to install cert-manager before installing this operator:
kubectl apply -f https://github.com/cert-manager/cert-manager/releases/download/v1.10.1/cert-manager.yaml
And after, we can install jaeger-operator:
helm install jaeger-op --set rbac.clusterRole=true jaegertracing/jaeger-operator
Minimal deployment
Deploying Jaeger in all its details is a topic well beyond the scope of this article. Here, we deploy Jaeger with all-in-one topology using the below configuration, which will be sufficient to demonstrate the integration:
# jaeger.yaml
apiVersion: jaegertracing.io/v1
kind: Jaeger
metadata:
  name: jaeger
The above configuration creates an instance named jaeger. It also creates a query-ui, an agent, and a collector. All these related services are prefixed with jaeger. It does not deploy a database like Cassandra or Elastic; instead, it relies on in-memory data processing.
kubectl apply -f jaeger.yaml
You can confirm Jaeger is running by doing a lookup on this CRD and on deployed
services:
$ kubectl get jaegers.jaegertracing.io
NAME 	STATUS	VERSION   STRATEGY   STORAGE   AGE
jaeger   Running   1.39.0	allinone   memory	5m52s

$ kubectl get services
NAME                                TYPE        CLUSTER-IP      EXTERNAL-IP   PORT(S)                                  AGE
kubernetes                          ClusterIP   10.43.0.1       <none>        443/TCP                                  76m
jaeger-op-jaeger-operator-metrics   ClusterIP   10.43.86.167    <none>        8383/TCP,8686/TCP                        82s
jaeger-collector-headless           ClusterIP   None            <none>        9411/TCP,14250/TCP,14267/TCP,14268/TCP   47s
jaeger-collector                    ClusterIP   10.43.163.147   <none>        9411/TCP,14250/TCP,14267/TCP,14268/TCP   47s
jaeger-query                        ClusterIP   10.43.27.251    <none>        16686/TCP                                47s
jaeger-agent                        ClusterIP   None            <none>        5775/UDP,5778/TCP,6831/UDP,6832/UDP      47s
Install and configure Traefik Proxy
Now it's time to deploy Traefik Proxy, which you'll do using the official Helm chart. If you haven't already, add Traefik Labs to your Helm repository list using the below commands:
helm repo add traefik https://traefik.github.io/charts
helm repo update
Next, deploy the latest version of Traefik in the kube-system namespace. For this demo, however, the standard configuration of the Helm chart won't be enough. As part of the deployment, you need to ensure that Jaeger integration is enabled in Traefik. You do this by passing additionalArguments configuration flags in the traefik-values.yaml file:
tracing:
  jaeger:
    samplingServerURL: http://jaeger-agent.default.svc:5778/sampling
    localAgentHostPort: jaeger-agent.default.svc:6831
As shown in the above configuration, you need to provide an address for the Jaeger agent. By default, this is localhost, and if you deploy jaeger-agent as a sidecar, this works as expected. In this deployment, however, you need to provide an explicit address for jaeger-agent, which corresponds to the jaeger-agent.default.svc hostname that was configured by the Helm chart.
helm install traefik traefik/traefik -f ./traefik-values.yaml
Once the pods are created, you can verify the Jaeger integration by using port forwarding to expose the Traefik dashboard:
kubectl port-forward $(kubectl -n kube-system get pods --selector "app.kubernetes.io/name=traefik" --output=name) 9000:9000
If you access the Traefik dashboard at http://localhost:9000/dashboard/, you will see that Jaeger distributed tracing is enabled under the Features section:

Now is also a good time to expose the Jaeger UI, which is served on port 16686:
kubectl port-forward service/jaeger-query 16686:16686
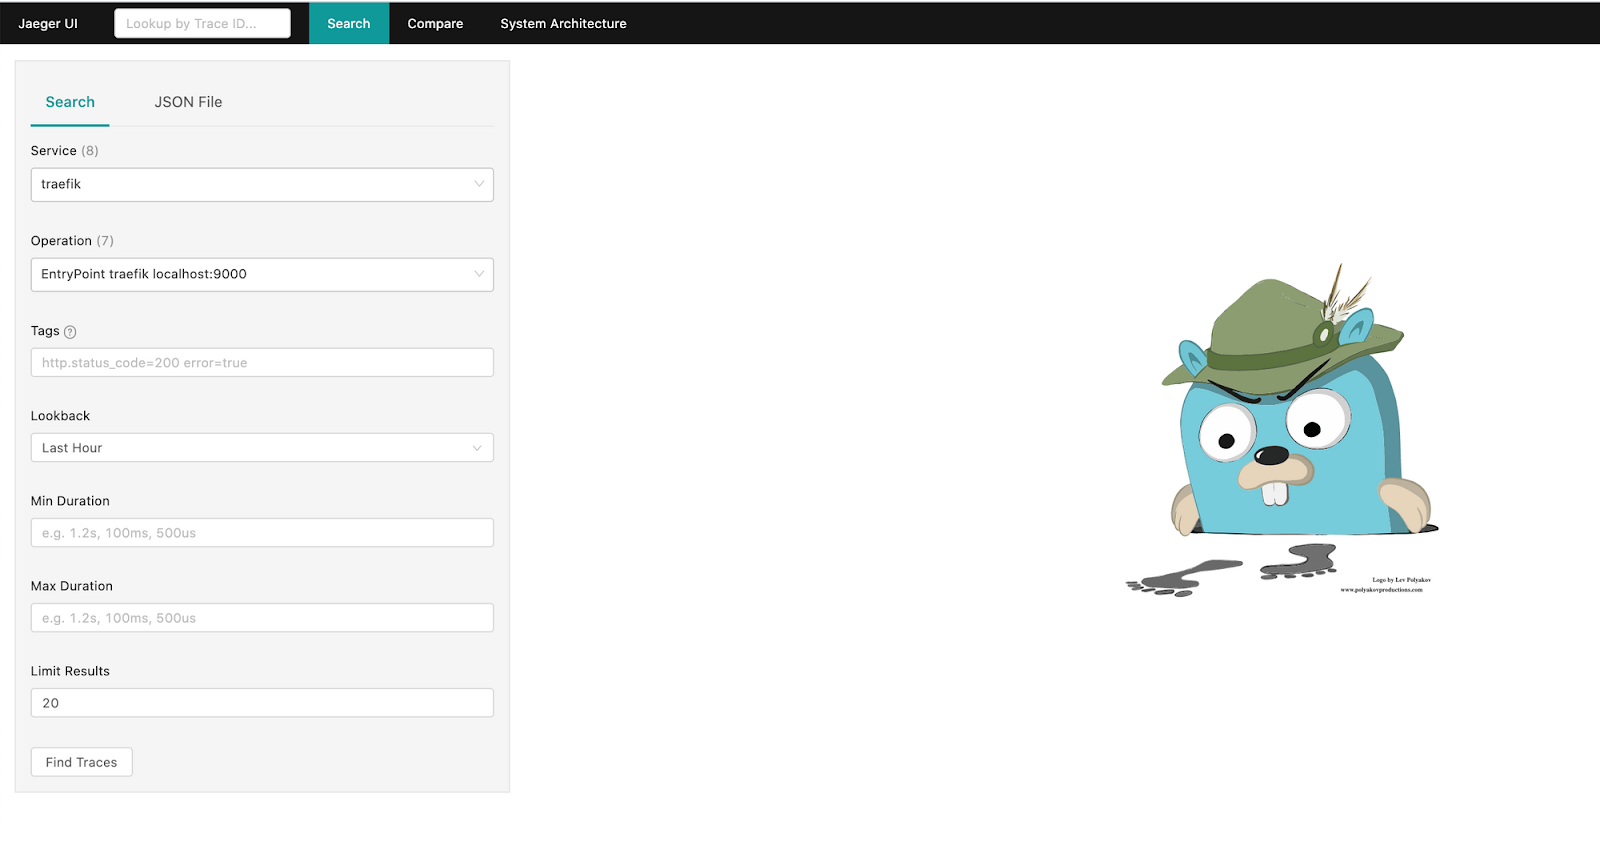
When you access the Jaeger dashboard at http://localhost:16686/, you will see traefik in the Service pull-down, and the Traefik endpoints will be listed in the Operations pull-down:
Deploy Hot R.O.D.
Now that your integration is working, you need an application to trace. For this purpose, let’s deploy Hot R.O.D. - Rides On Demand, which is an example application created by the Jaeger team. It is a demo ride-booking service that consists of three microservices: driver-service, customer-service, and route-service. Each service also has accompanying storage, such as a MySQL database or Redis cache.
The application includes four pre-built "customer personas" who can book a ride using the application UI. When a car is booked, the application will find a driver and dispatch the car.
Throughout the process, Jaeger will capture the user request as it flows through the various services (driver-service, customer-service, route-service). Individual service handling will be shown as a span, and all related spans are visualized in a graph known as the trace.
Deploy the Service along with the IngressRoute using this following configuration file:
$ kubectl apply -f hotrod.yaml
deployment.apps/hotrod created
service/hotrod created
ingressroute.traefik.containo.us/hotrod created
The hotrod route will match the hostname hotrod.localhost, which allows you to open the application UI on http://hotrod.localhost:8081/.

In the above UI, you can see the four prebuilt customer personas. This UI is not required for this distributed tracing demo, however, as you can use command-line tools.
Application traces
To see Jaeger in action, send a few user requests to the application using a sample customer persona. For example, try the following curl commands:
curl -I "http://localhost:8081/dispatch?customer=392" -H "host:hotrod.localhost"
curl -I "http://localhost:8081/dispatch?customer=123" -H "host:hotrod.localhost"
Each command triggers a sequence of requests to produce the expected result. You can see the generated traces in the Jaeger UI when you select traefik as the Service and hotrod.localhost as the Operation and click Find Traces:
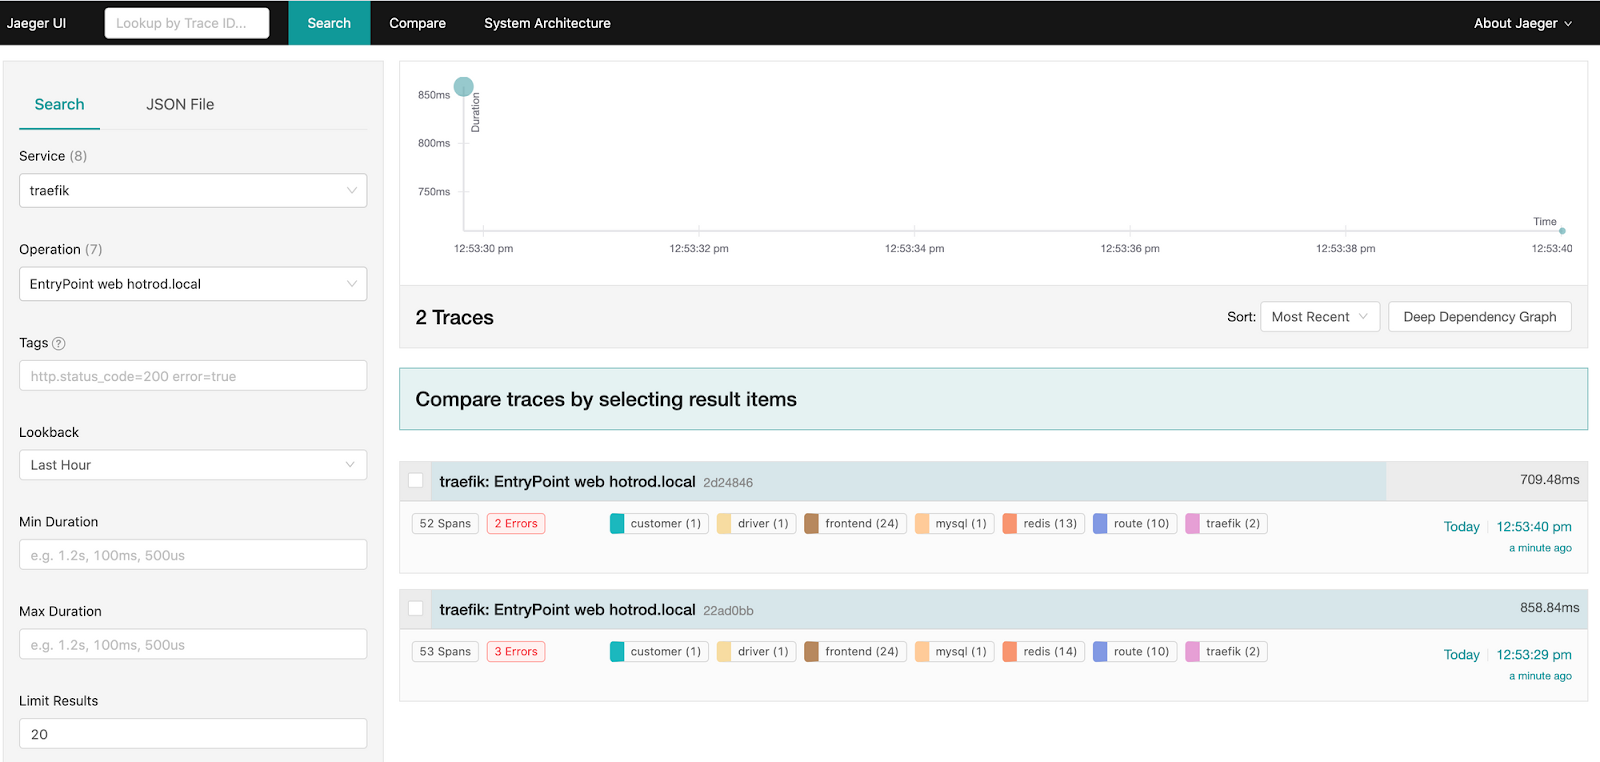
Select either of the traces to explore the detailed request flow.
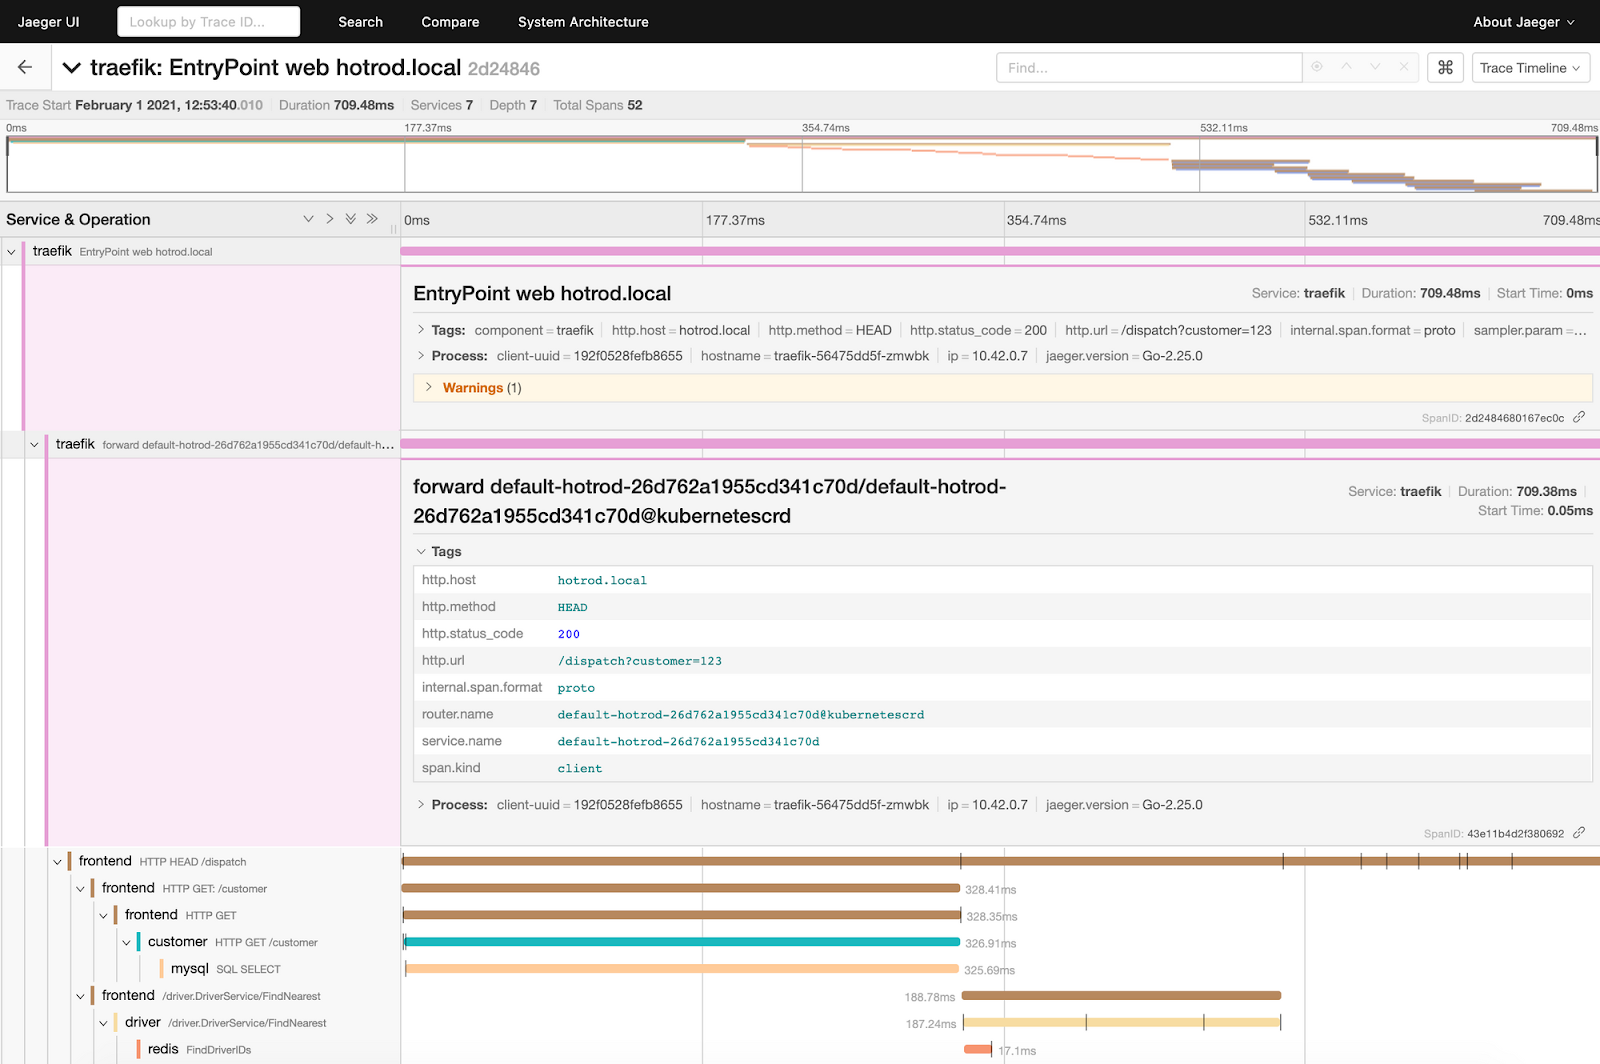
The display above shows the top two spans expanded to show the information forwarded by Traefik Proxy. Each span shows the request duration, along with non-mandatory sections for Tags, Process, and Logs. The Tags section contains key-value pairs that can be associated with request handling.
The Tags field of the topmost traefik span shows information related to HTTP handling, such as the status code, URL, host, and so on. The next span shows the routing information for the request, including the router and service names.
Jaeger can also deduce an overall architecture by analyzing the request traces. This diagram is available under the System Architecture > DAG tab:
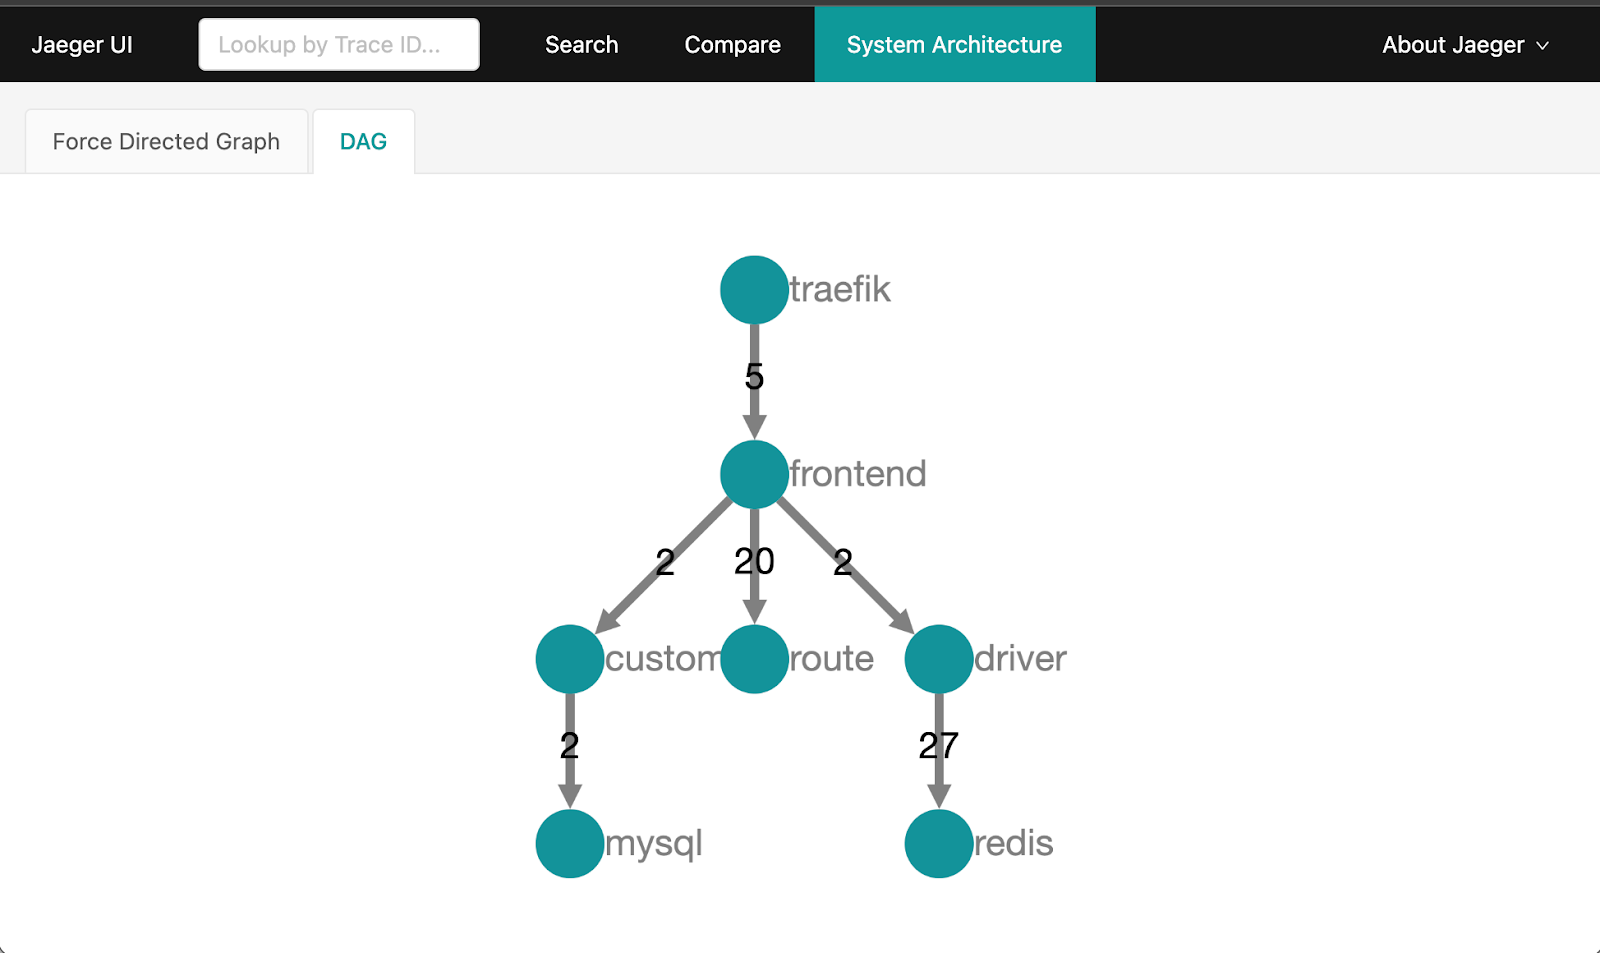
The graph shows that you made two requests, which were routed to the frontend service. The frontend service then fanned out requests to the customer, driver, and route services.
Returning to the Search tab of the Jaeger UI, you can see that in the current cluster, you have traces generated for the following three entrypoints :
traefik-dashboard, which you used for lookupping api, used by Kubernetes for health checkshotrod.localhost, used by the Hot R.O.D. application
As you deploy more applications to your cluster, you will see more entries in the Operations drop-down, based on the entrypoint match.
Wrap up
This post has presented a very simple demonstration of integrating Traefik Proxy with Jaeger. There is much more to explore with Jaeger, and similar integrations can be done with other distributed tracing systems, such as NewRelic or Datadog. Whichever one you choose, Traefik makes it easy to follow the progress of each request and gain insights into the application flow.
We hope you've enjoyed this series of articles on how Traefik's capabilities can enable app monitoring and health analysis for SRE. If you missed the earlier installments on log aggregation and metrics, respectively, be sure to take a look:
- Part I: Log Aggregation in Kubernetes with Traefik Proxy
- Part II: Capture Traefik Metrics for Apps on Kubernetes with Prometheus
All three articles demonstrate how readily available open source software, including Traefik Proxy, can empower practices that both increase application uptime and contribute to improving the design of distributed systems.
If you'd like to explore new features of Traefik on monitoring and visibility, check out Traefik Proxy v3 Beta 1, with native OpenTelemetry support.