Capture Traefik Metrics for Apps on Kubernetes with Prometheus


Originally published: February 2021
Updated: March 2022
Monitoring distributed systems is one of the core precepts of site reliability engineering (SRE), as defined by Google. When Traefik Proxy is deployed as a Kubernetes ingress controller, it becomes an integral part of this practice.
This is the second in a series of blog posts on using Traefik Proxy to enable SRE practices. In the first part of this series, we discussed how Traefik's built-in logging features can help to provide visibility, especially when combined with a set of open source observability projects like Open Telemetry, Elastic Stack, Grafana Stack, etc.
In this part, we explore how to use Prometheus and Grafana to derive similar insights from metrics generated by Traefik Proxy.
Prerequisites
If you want to follow along with this tutorial, you'll need to have a few things set up first.
- A Kubernetes cluster running. For this tutorial, we’ll use kind and Docker on
localhost - The kubectl command-line tool, configured to point to your cluster.
- The set of configuration files that accompany this article, which are available on GitHub. You do not need to have Traefik 2.x preinstalled, you'll do that in the next step.
kind requires some config in order to use an IngressController on localhost:
$ cat kind.config
kind: Cluster
apiVersion: kind.x-k8s.io/v1alpha4
nodes:
- role: control-plane
  extraPortMappings:
  - containerPort: 30000
    hostPort: 80
    protocol: TCP
  - containerPort: 30001
    hostPort: 443
    protocol: TCP
All config files are in the public GitHub repository that accompany this article, so you just have to clone it and create our local cluster with this network configuration:
git clone <https://github.com/traefik-tech-blog/traefik-sre-metrics/>
kind create cluster --config=kind.config
kubectl cluster-info
If you take a look at the nodes, you see it takes about 30 seconds before the network (and so the nodes) are ready.
$ kubectl get nodes
NAME                 STATUS     ROLES                  AGE   VERSION
kind-control-plane   NotReady   control-plane,master   11s   v1.21.1
# wait 30 seconds
$ kubectl get nodes
NAME                 STATUS   ROLES                  AGE   VERSION
kind-control-plane   Ready    control-plane,master   38s   v1.21.1
Deploy Traefik Proxy
A good way to deploy Traefik Proxy on Kubernetes is to use resources YAML files.
First, let’s deploy the required CRDs and RBAC for Traefik Proxy.
kubectl apply -f ingresses/traefik-crds.yaml
kubectl apply -f ingresses/traefik-rbac.yaml
You want this Traefik instance to be scraped by Prometheus, so add those annotations:
      annotations:
        prometheus.io/scrape: "true"
        prometheus.io/port: "80"
Let’s use a simple Traefik instance, with one replica and a static config file.
$ cat ingresses/traefik-deployment.yaml
---
kind: Deployment
apiVersion: apps/v1
metadata:
  namespace: default
  name: traefik
  labels:
    app: traefik
spec:
  replicas: 1
  selector:
    matchLabels:
      app: traefik
  template:
    metadata:
      labels:
        app: traefik
      annotations:
        prometheus.io/scrape: "true"
        prometheus.io/port: "80"
    spec:
      serviceAccountName: traefik-ingress-controller
      containers:
        - name: traefik
          image: traefik:v2.6
          imagePullPolicy: IfNotPresent
          args:
            - --configfile=/config/static.yaml
          volumeMounts:
            - name: static-config
              mountPath: "/config"
          ports:
            - name: web
              containerPort: 80
            - name: websecure
              containerPort: 443
      volumes:
        - name: static-config
          configMap:
            name: traefik-static-config
With this local setup, Traefik Service nodePort has to be configured with the containerPort provided with kind.config.
$ cat ingresses/traefik-service.yaml
---
apiVersion: v1
kind: Service
metadata:
  name: traefik
spec:
  type: NodePort
  ports:
    - protocol: TCP
      name: web
      port: 80
      nodePort: 30000
    - protocol: TCP
      name: websecure
      port: 443
      nodePort: 30001
  selector:
    app: traefik
For Traefik Proxy configuration, you temporarily enable debug mode on log level and activate Traefik Dashboard and Metrics. In order to have proper metrics for backends, you unify forward timeout and maximum latency collected within Prometheus buckets to 10 seconds.
If you don’t unify them, you’ll miss in your histogram everything between maximum bucket limit and forward timeout.
$ cat ingresses/traefik-static-config.yaml
---
apiVersion: v1
kind: ConfigMap
metadata:
  name: traefik-static-config
data:
  static.yaml: |
    entryPoints:
      web:
        address: ':80'
      websecure:
        address: ':443'

    log:
      level: DEBUG

    api: {}

    metrics:
      prometheus:
        buckets:
          - 0.1
          - 0.3
          - 1.2
          - 5.0
          - 10.0

    forwardingTimeouts:
      dialTimeout: '10s'

    providers:
      kubernetesCRD:
        allowCrossNamespace: true
        allowExternalNameServices: true
On localhost, you can enable the dashboard without password either by hostname provided with Docker or on path prefix — do both using IngressRoute.
$ cat ingresses/dashboard-ingressroute.yaml
---
apiVersion: traefik.containo.us/v1alpha1
kind: IngressRoute
metadata:
  name: traefik
  namespace: default
spec:
  entryPoints:
    - web
  routes:
    - kind: Rule
      match: Host(`dashboard.docker.localhost`) || PathPrefix(`/dashboard`)
      services:
        - name: api@internal
          kind: TraefikService
The process is quite similar for pulling metrics:
$ cat ingresses/metrics-ingressroute.yaml
---
apiVersion: traefik.containo.us/v1alpha1
kind: IngressRoute
metadata:
  name: traefik-metrics
  namespace: default
spec:
  entryPoints:
    - web
  routes:
    - kind: Rule
      match: Host(`metrics.docker.localhost`) || PathPrefix(`/metrics`)
      services:
        - name: prometheus@internal
          kind: TraefikService
Now, let’s deploy Traefik Proxy:
kubectl apply -f ingresses/traefik-static-config.yaml
kubectl apply -f ingresses/traefik-deployment.yaml
kubectl apply -f ingresses/traefik-service.yaml
kubectl apply -f ingresses/dashboard-ingressroute.yaml
kubectl apply -f ingresses/metrics-ingressroute.yaml
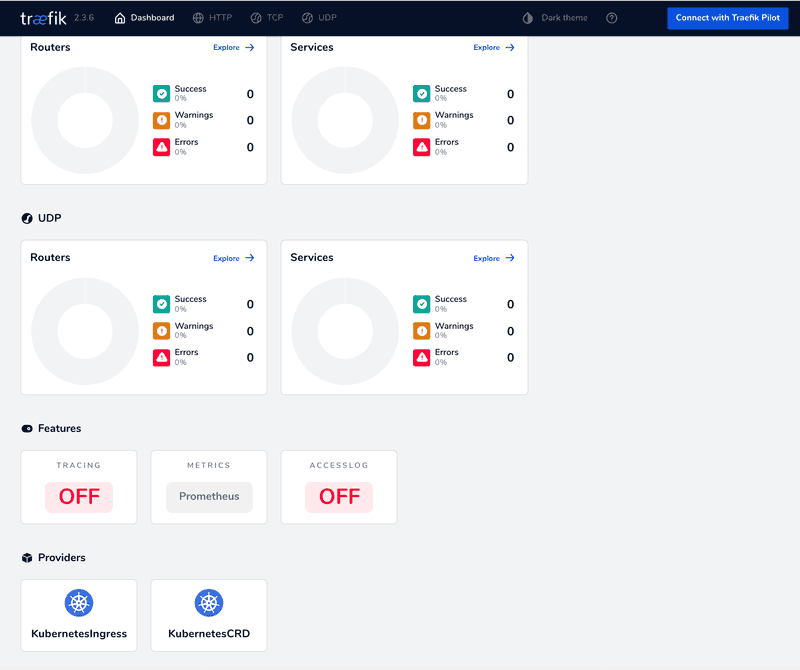
With the Traefik Dashboard accessible from your web browser, you should now see that Prometheus metrics are enabled in the "Features" section of the dashboard.
If you deployed on your PC, you will be able to access it at http://dashboard.docker.localhost or at http://localhost/dashboard/ (note the required trailing slash for path prefix):
It’s also in the debug log:
$ kubectl logs -l app=traefik
[...]
level=debug msg="Added outgoing tracing middleware **prometheus@internal**" routerName=default-traefik-metrics-94a43d91f71be7aa1f95@kubernetescrd middlewareName=**tracing** middlewareType=TracingForwarder entryPointName=web
level=debug msg="Creating middleware" middlewareName=**metrics-entrypoint** middlewareType=Metrics entryPointName=traefik
level=debug msg="Creating middleware" entryPointName=web middlewareName=**metrics-entrypoint** middlewareType=Metrics
level=debug msg="Creating middleware" entryPointName=websecure middlewareName=**metrics-entrypoint** middlewareType=Metrics
level=debug msg="Creating middleware" middlewareType=Metrics entryPointName=traefik middlewareName=**metrics-entrypoint**
So, you now have access to http://metrics.docker.localhost/ or http://localhost/metrics/ endpoint to see metrics currently provided by Traefik Proxy:
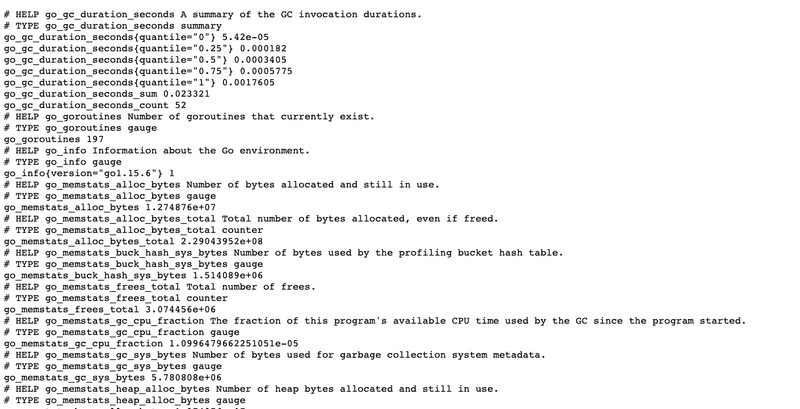
At this point, you don’t have any metrics on apps. You did not deploy an app, so this is expected.
Deploy a web app
Let’s deploy a simple web app like whoami:
kubectl apply -f apps/
The web app is now deployed on the Traefik Dashboard, in HTTP Routers view.
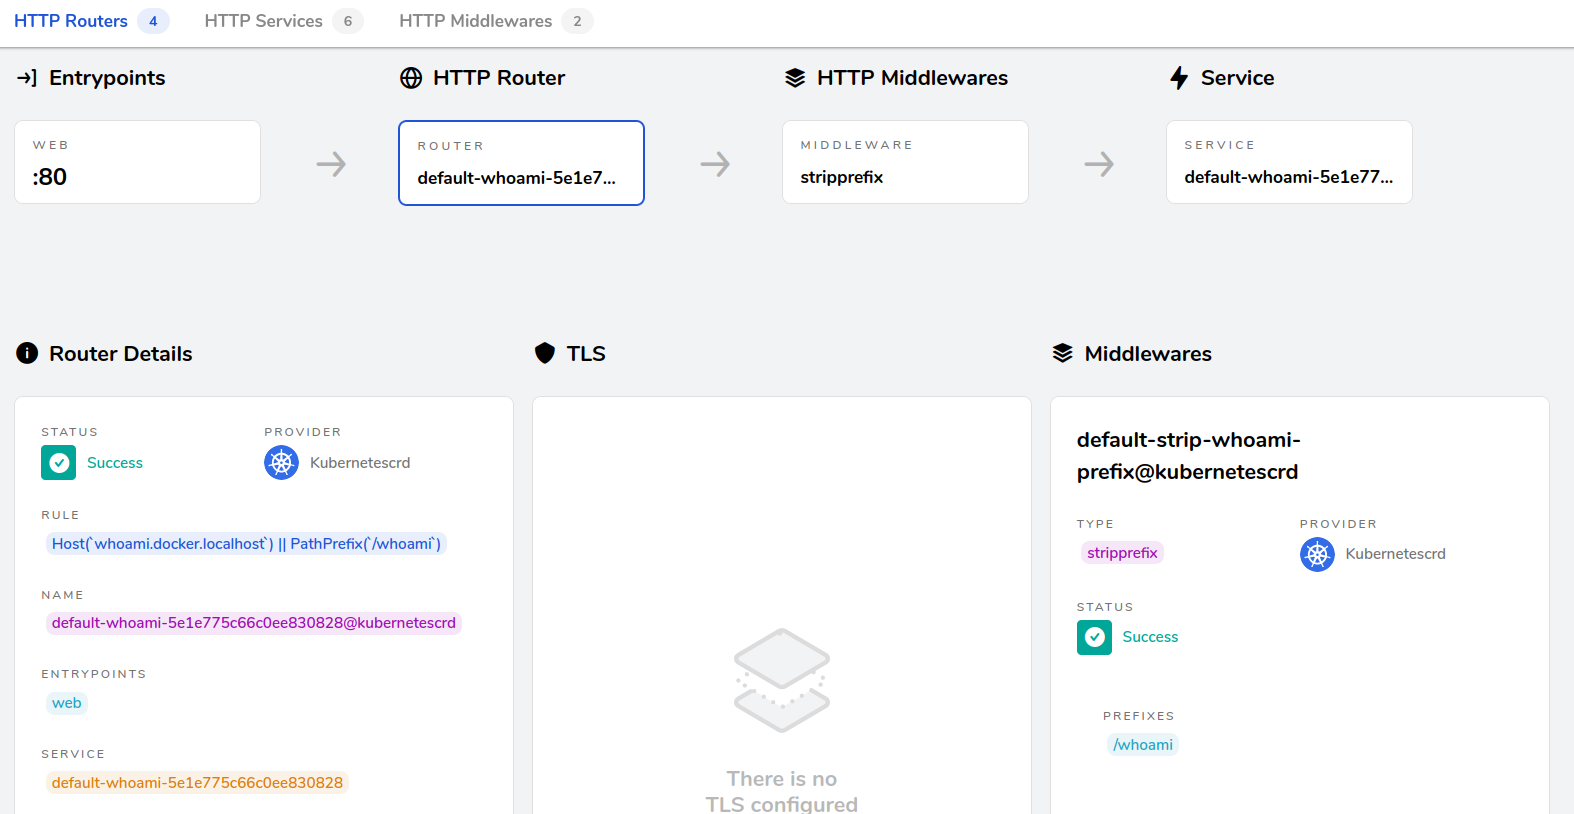
Access to this web app is at http://whoami.docker.localhost or http://localhost/whoami/.
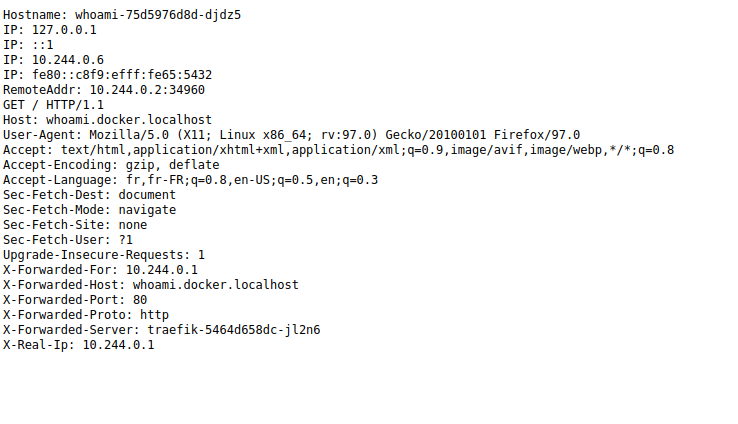
With access to the web app, Traefik Proxy has started to collect related metrics. New metrics are now available at http://metrics.docker.localhost/.
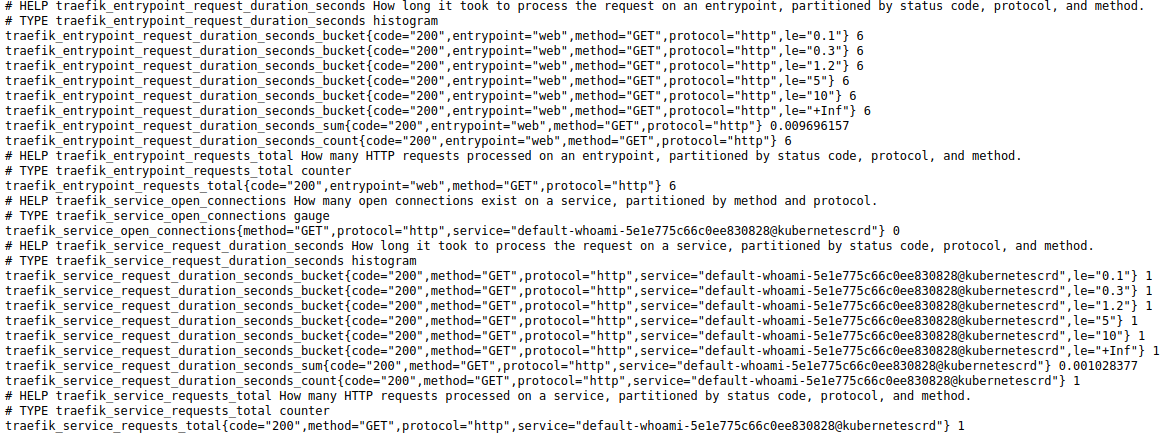
There are buckets, sum, count, or requests, per code and per service.
Deploy the Prometheus server
For the Prometheus configuration, use kubernetes_sd_config, the dynamic service discovery dedicated to Kubernetes with a selector on Traefik pods:
- job_name: 'kubernetes-pods'
  kubernetes_sd_configs:
    - role: pod
      selectors:
        - role: pod
          label: "app=traefik"
It’s quite useful to use annotations like the ones below:
prometheus.io/scrape: Prometheus will scrape pods where this annotation is set as true.prometheus.io/path: If the metrics path is not/metrics, define it with this annotation.prometheus.io/port: Scrape the pod only on the indicated port instead of the default behavior that is all pod’s declared ports.prometheus.io/scheme: Specify if HTTPS should be used.
You need to add relabel_configs in order for them to works as expected.
relabel_configs:
  - source_labels: [__meta_kubernetes_pod_annotation_prometheus_io_scrape]
    action: keep
    regex: true
  - source_labels: [__meta_kubernetes_pod_annotation_prometheus_io_path]
    action: replace
    target_label: __metrics_path__
    regex: (.+)
  - source_labels: [__address__, __meta_kubernetes_pod_annotation_prometheus_io_port]
    action: replace
    regex: ([^:]+)(?::\\d+)?;(\\d+)
    replacement: $1:$2
    target_label: __address__
  - source_labels: [__meta_kubernetes_service_annotation_prometheus_io_scheme]
    action: replace
    target_label: __scheme__
    regex: (https?)
The complete config file for Prometheus looks like this:
$ cat metrics/prometheus-configmap.yaml
apiVersion: v1
kind: ConfigMap
metadata:
  name: prometheus-config
  labels:
    name: prometheus-config
data:
  prometheus.yml: |-
    global:
      scrape_interval: 5s
      evaluation_interval: 5s
    scrape_configs:
      - job_name: 'kubernetes-pods'
        kubernetes_sd_configs:
          - role: pod
            selectors:
              - role: pod
                label: "app=traefik"
        relabel_configs:
          - source_labels: [__meta_kubernetes_pod_annotation_prometheus_io_scrape]
            action: keep
            regex: true
          - source_labels: [__meta_kubernetes_pod_annotation_prometheus_io_path]
            action: replace
            target_label: __metrics_path__
            regex: (.+)
          - source_labels: [__address__, __meta_kubernetes_pod_annotation_prometheus_io_port]
            action: replace
            regex: ([^:]+)(?::\\d+)?;(\\d+)
            replacement: $1:$2
            target_label: __address__
          - source_labels: [__meta_kubernetes_service_annotation_prometheus_io_scheme]
            action: replace
            target_label: __scheme__
            regex: (https?)
Did you know that you can deploy Prometheus as a non-root user and on a volatile directory for testing purposes? Well, it’s true!
$ cat metrics/prometheus-deployment.yaml
apiVersion: apps/v1
kind: Deployment
metadata:
  name: prometheus
  labels:
    app: prometheus
spec:
  replicas: 1
  selector:
    matchLabels:
      app: prometheus
  template:
    metadata:
      labels:
        app: prometheus
    spec:
      containers:
        - name: prometheus
          image: prom/prometheus
          args:
            - "--config.file=/etc/prometheus/prometheus.yml"
            - "--web.enable-lifecycle"
            - "--storage.tsdb.path=/prometheus/data"
            - "--storage.tsdb.wal-compression"
            - "--storage.tsdb.retention.size=1GB"
            - "--storage.tsdb.retention.time=2h"
            - "--log.level=debug"
          ports:
            - containerPort: 9090
          volumeMounts:
            - name: prometheus-config
              mountPath: /etc/prometheus/
            - name: prometheus-storage
              mountPath: /prometheus/
      serviceAccountName: prometheus
      securityContext:
        fsGroup: 2000
        runAsNonRoot: true
        runAsUser: 1000
      volumes:
        - name: prometheus-config
          configMap:
            defaultMode: 420
            name: prometheus-config
        - name: prometheus-storage
          emptyDir: {}
RBAC, Service, and IngressRoute on Prometheus are quite similar to whoami apps, so go directly to the Prometheus server deployment.
kubectl -f metrics/
You can now open the Prometheus Web Interface at http://prometheus.docker.localhost or http://localhost/prometheus/.
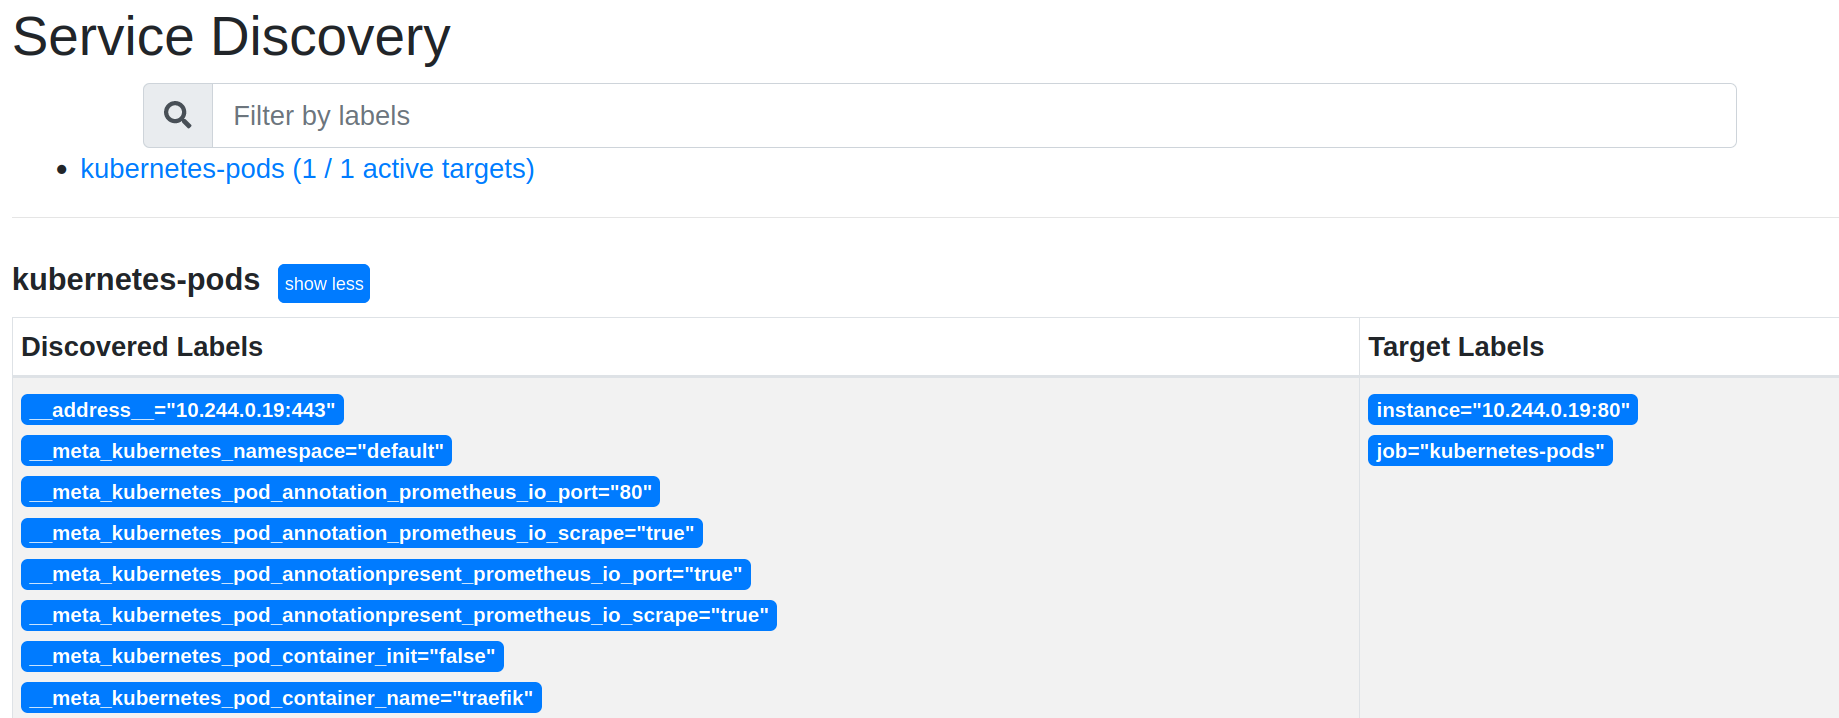
In Status → Service Discovery, you see discovered labels and target labels:
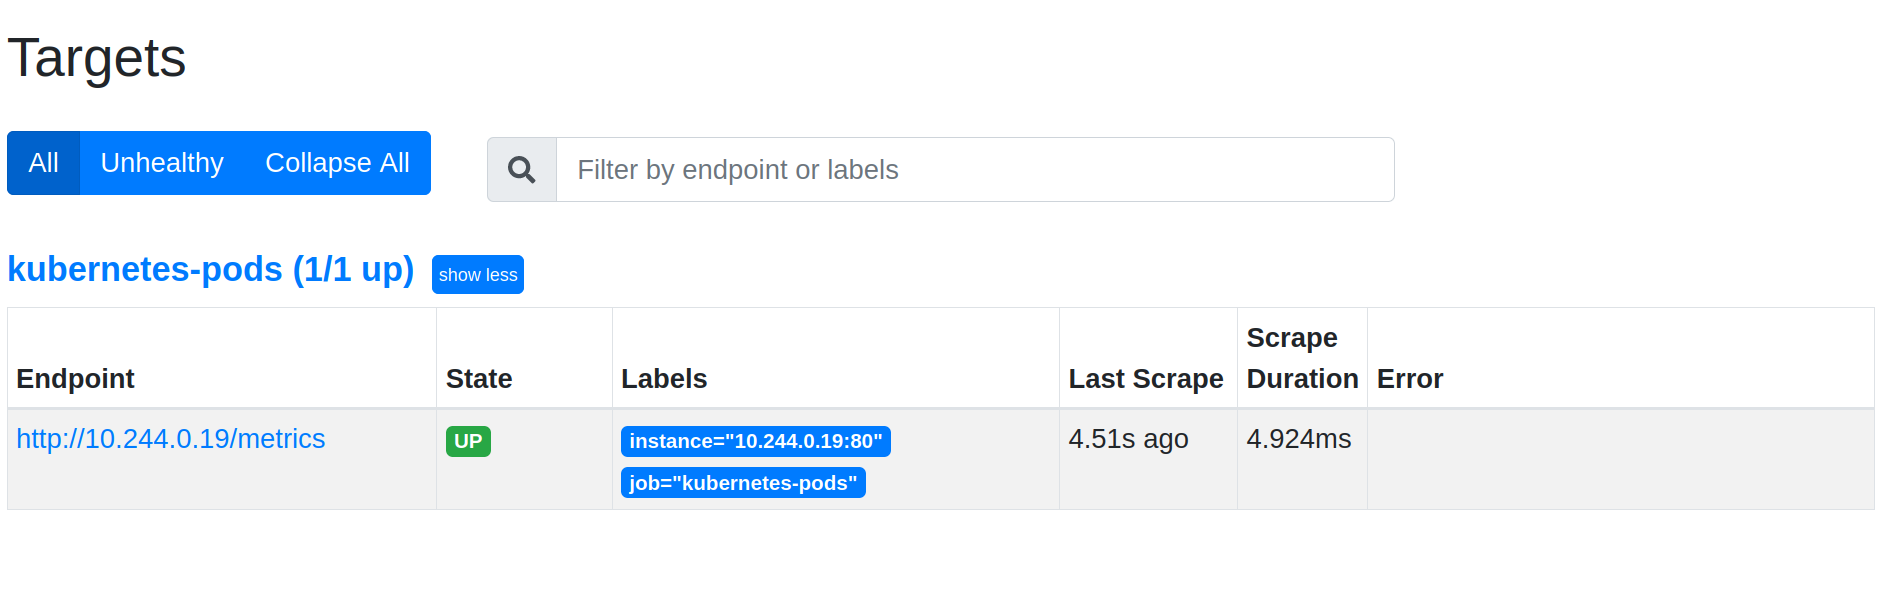
And in Status → Targets, you see that the Traefik pod is scrapped by Prometheus:
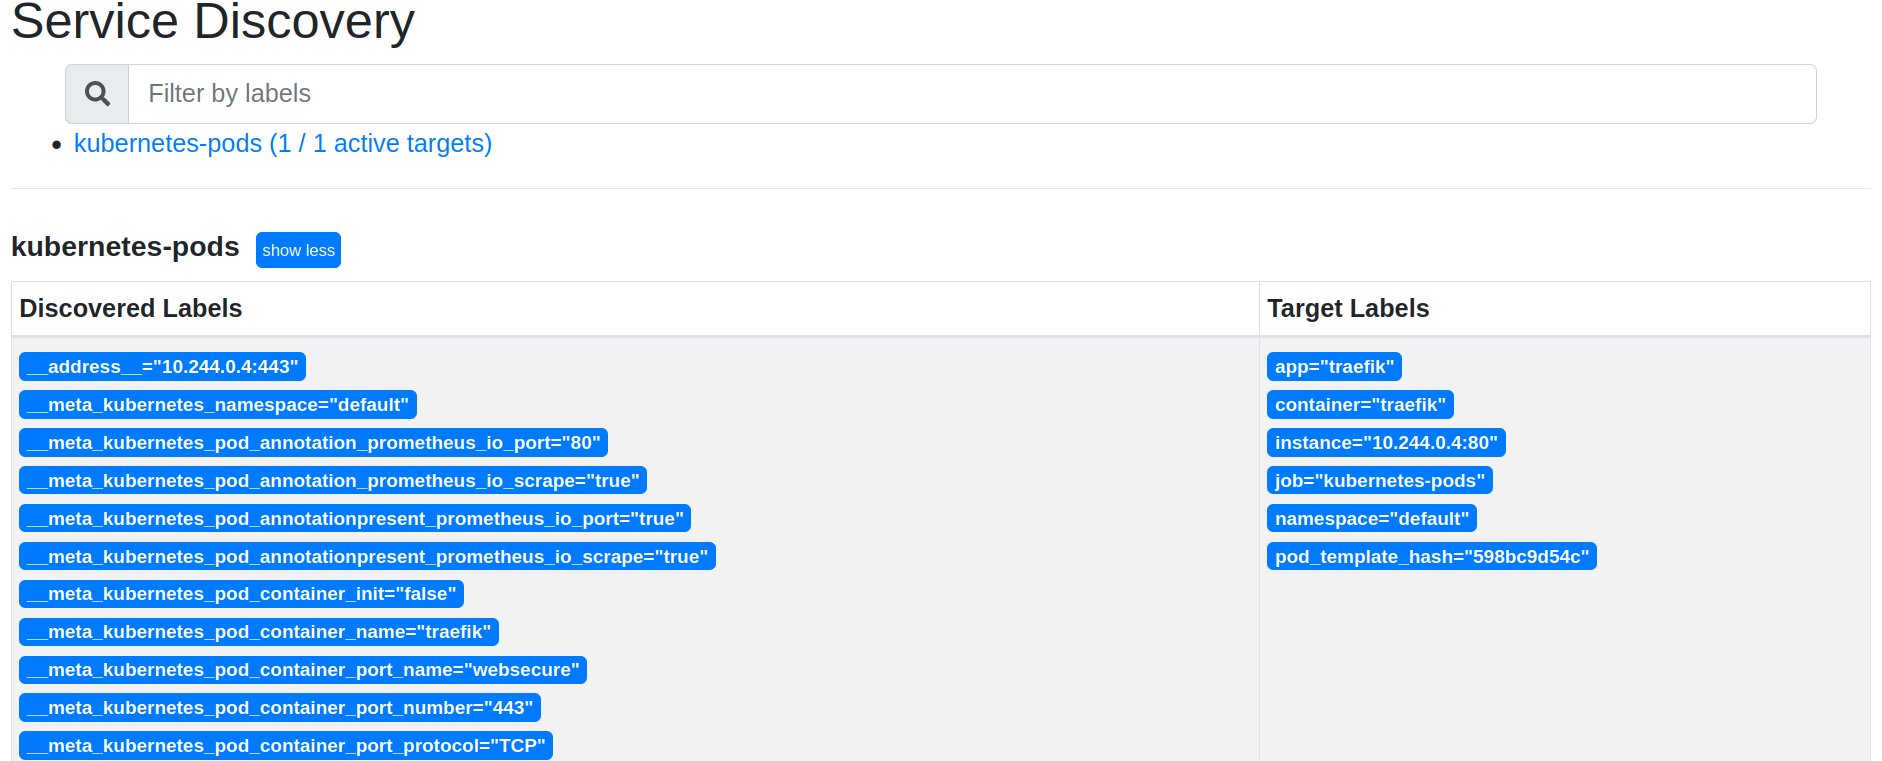
Prometheus discovers automatically Kubernetes labels, namespace, container, or service names. In order to get them on metrics, you need a relabel_config like this:
- action: labelmap
  regex: __meta_kubernetes_pod_label_(.+)
- source_labels: [__meta_kubernetes_namespace]
  action: replace
  target_label: namespace
- source_labels: [__meta_kubernetes_service_name]
  action: replace
  target_label: service
- source_labels: [__meta_kubernetes_pod_container_name]
  action: replace
  target_label: container
Reload Kubernetes static config:
kubectl apply -f metrics/prometheus-config.yaml
kubectl delete pod -l app=prometheus
Service Discovery now shows the expected container label in service discovery:
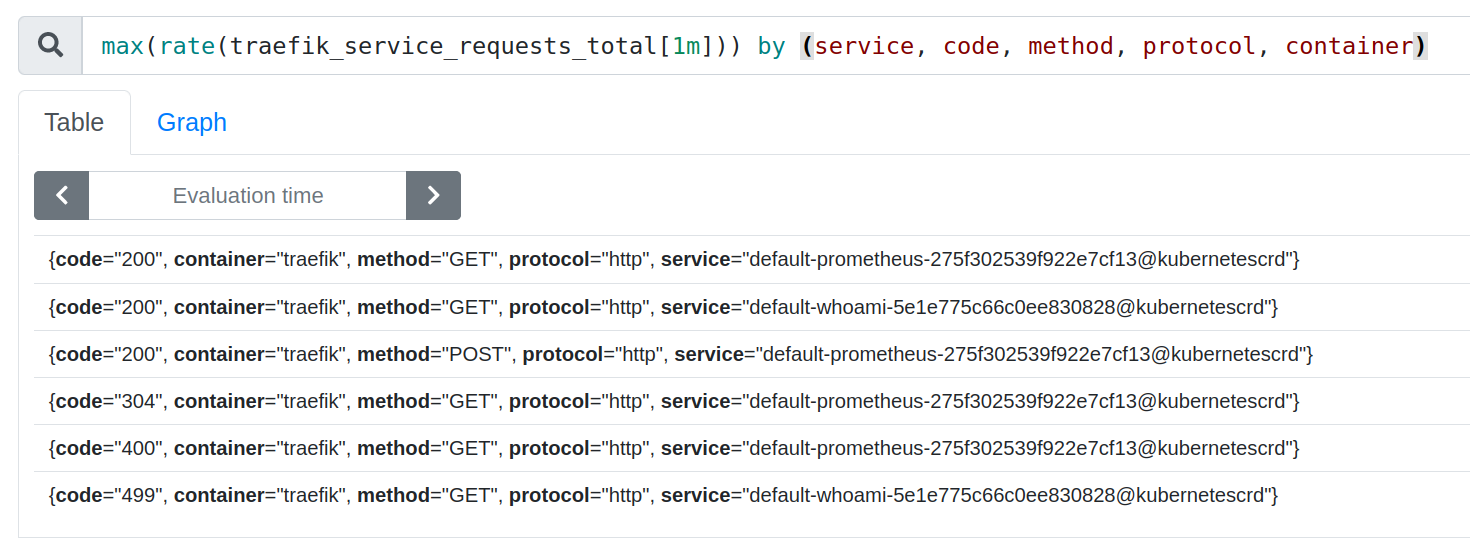
On the Graph tab (http://prometheus.docker.localhost/graph) of your local Prometheus Web UI, you can test some PromQL requests. Let’s try with traefik_service_requests_total:
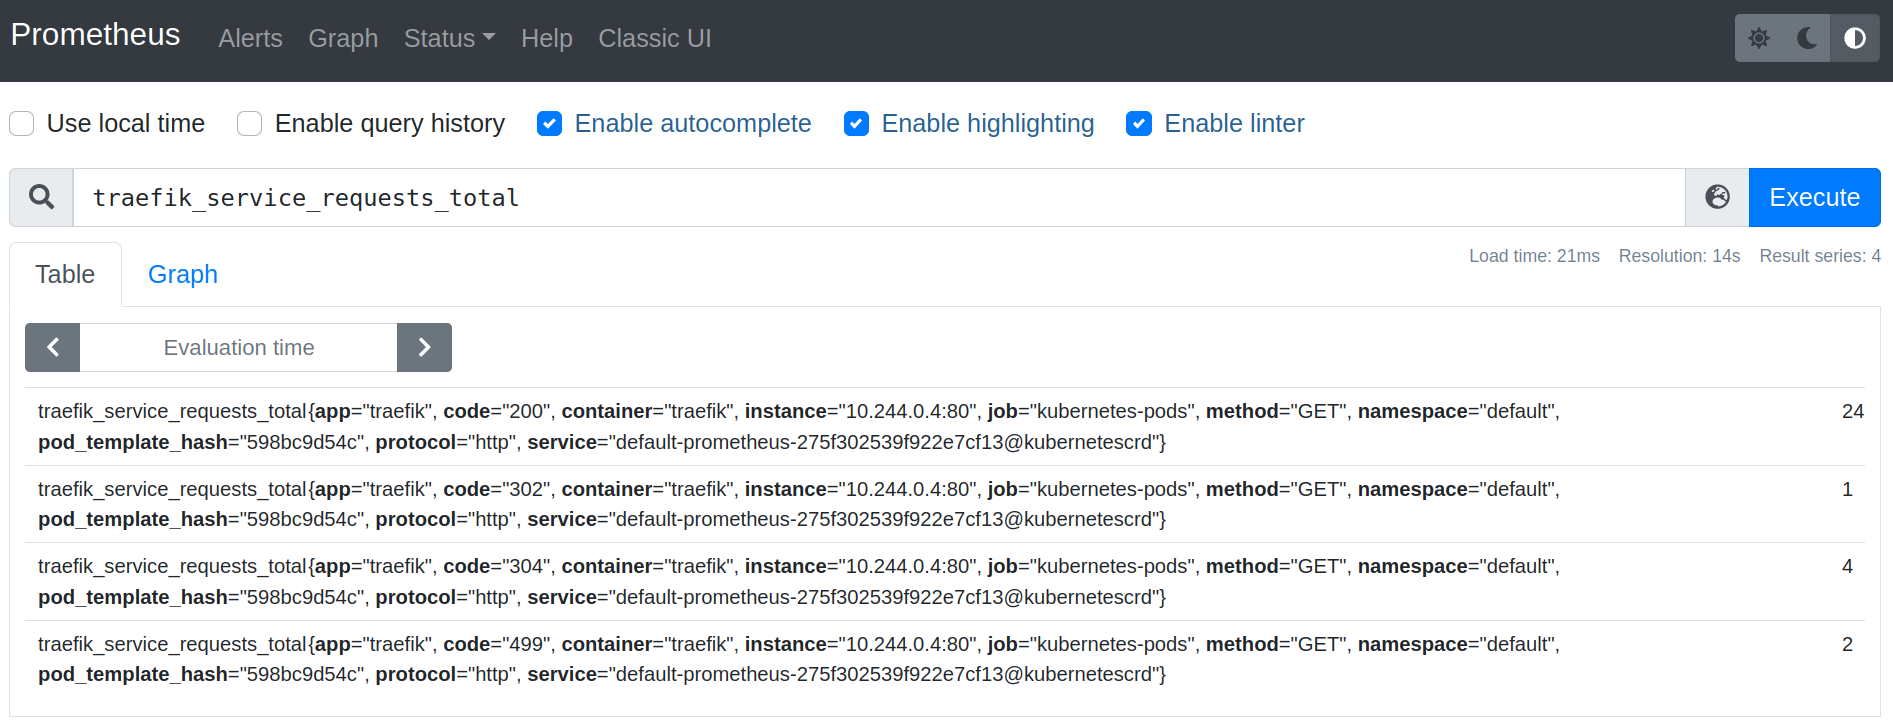
Note that you need to generate some traffic before playing with PromQL.
Simulate user traffic
You can hit the whoami web app with ab to generate some traffic. These requests will in turn generate metrics. Let’s send 1m requests with a concurrency level of 500:
$ ab -k -c 500 -n 1000000 <http://whoami.docker.localhost/>
This is ApacheBench, Version 2.3 <$Revision: 1843412 $>
Copyright 1996 Adam Twiss, Zeus Technology Ltd, <http://www.zeustech.net/>
Licensed to The Apache Software Foundation, <http://www.apache.org/>

Benchmarking whoami.docker.localhost (be patient)
Completed 100000 requests
Completed 200000 requests
Completed 300000 requests
Completed 400000 requests
Completed 500000 requests
Completed 600000 requests
Completed 700000 requests
Completed 800000 requests
Completed 900000 requests
Completed 1000000 requests
Finished 1000000 requests

Server Software:        traefik-598bc9d54c-d54g4
Server Hostname:        whoami.docker.localhost
Server Port:            80

Document Path:          /
Document Length:        433 bytes

Concurrency Level:      500
Time taken for tests:   94.272 seconds
Complete requests:      1000000
Failed requests:        0
Keep-Alive requests:    1000000
Total transferred:      575000000 bytes
HTML transferred:       433000000 bytes
Requests per second:    10607.65 [#/sec] (mean)
Time per request:       47.136 [ms] (mean)
Time per request:       0.094 [ms] (mean, across all concurrent requests)
Transfer rate:          5956.44 [Kbytes/sec] received

Connection Times (ms)
              min  mean[+/-sd] median   max
Connect:        0    0   0.4      0      34
Processing:     0   47  50.8     30     700
Waiting:        0   47  50.8     30     700
Total:          0   47  50.8     30     700

Percentage of the requests served within a certain time (ms)
  50%     30
  66%     54
  75%     69
  80%     80
  90%    113
  95%    147
  98%    193
  99%    230
 100%    700 (longest request)
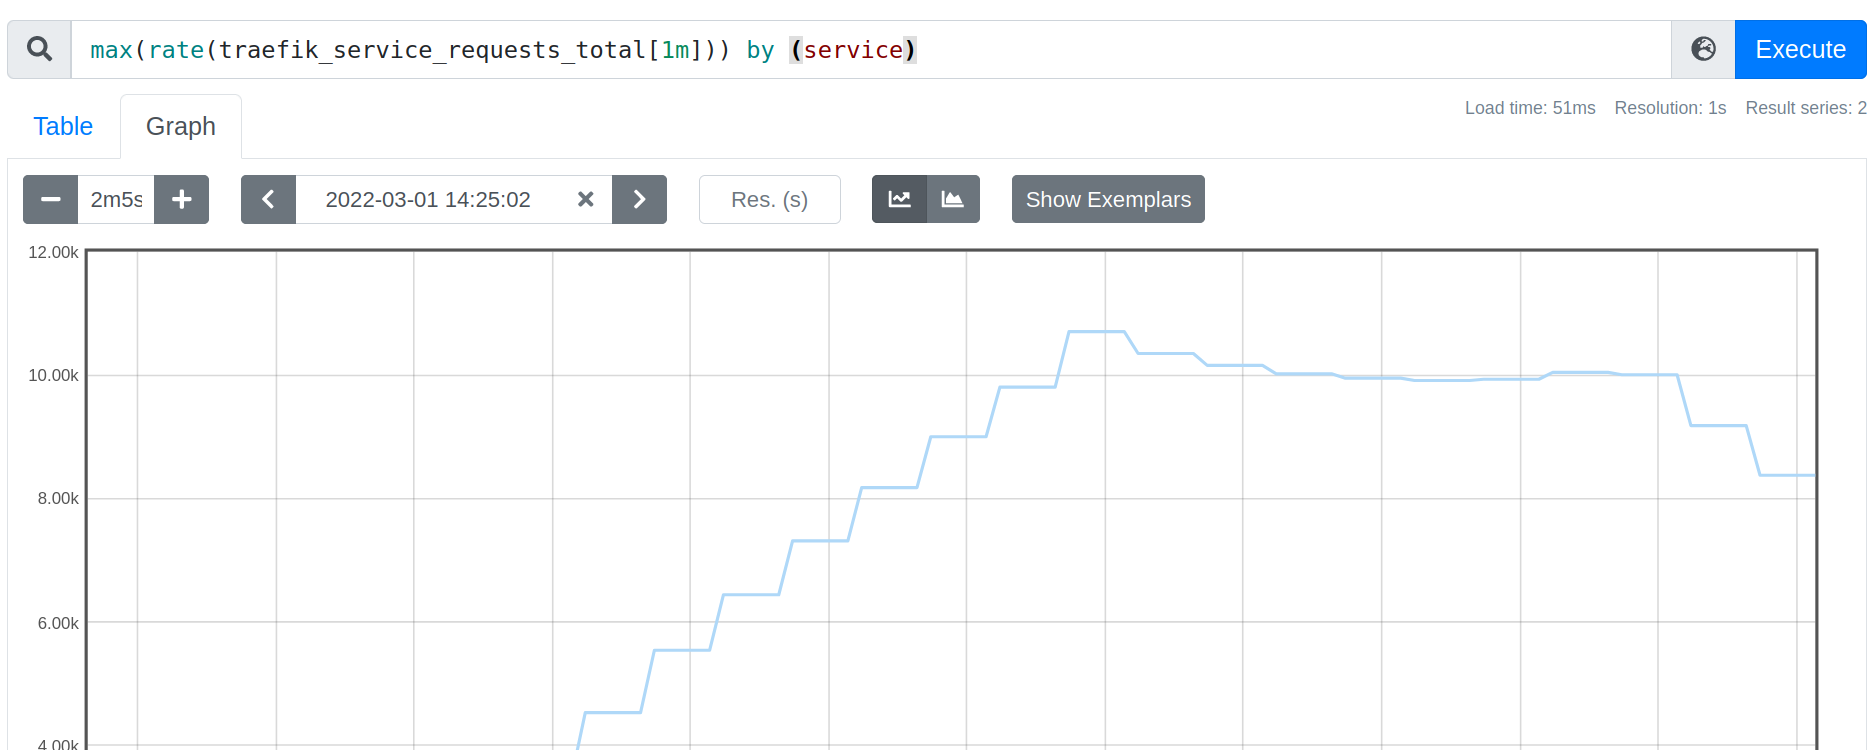
The ab results are consistent with metrics from Traefik Proxy which is around 10krps.
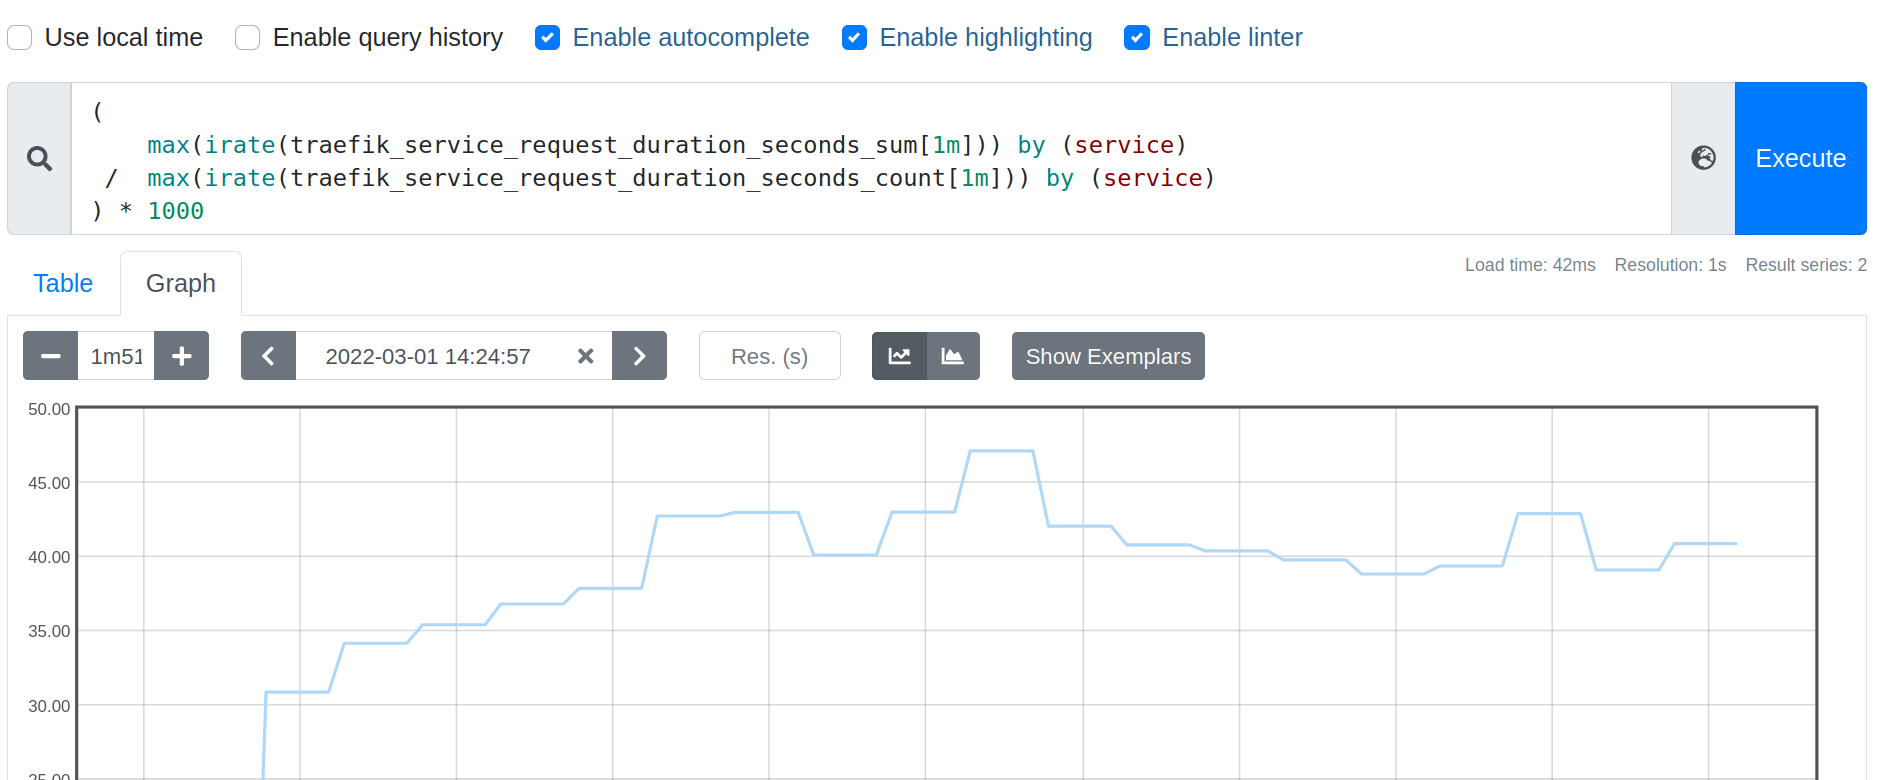
The mean request duration nears 47ms on this service:
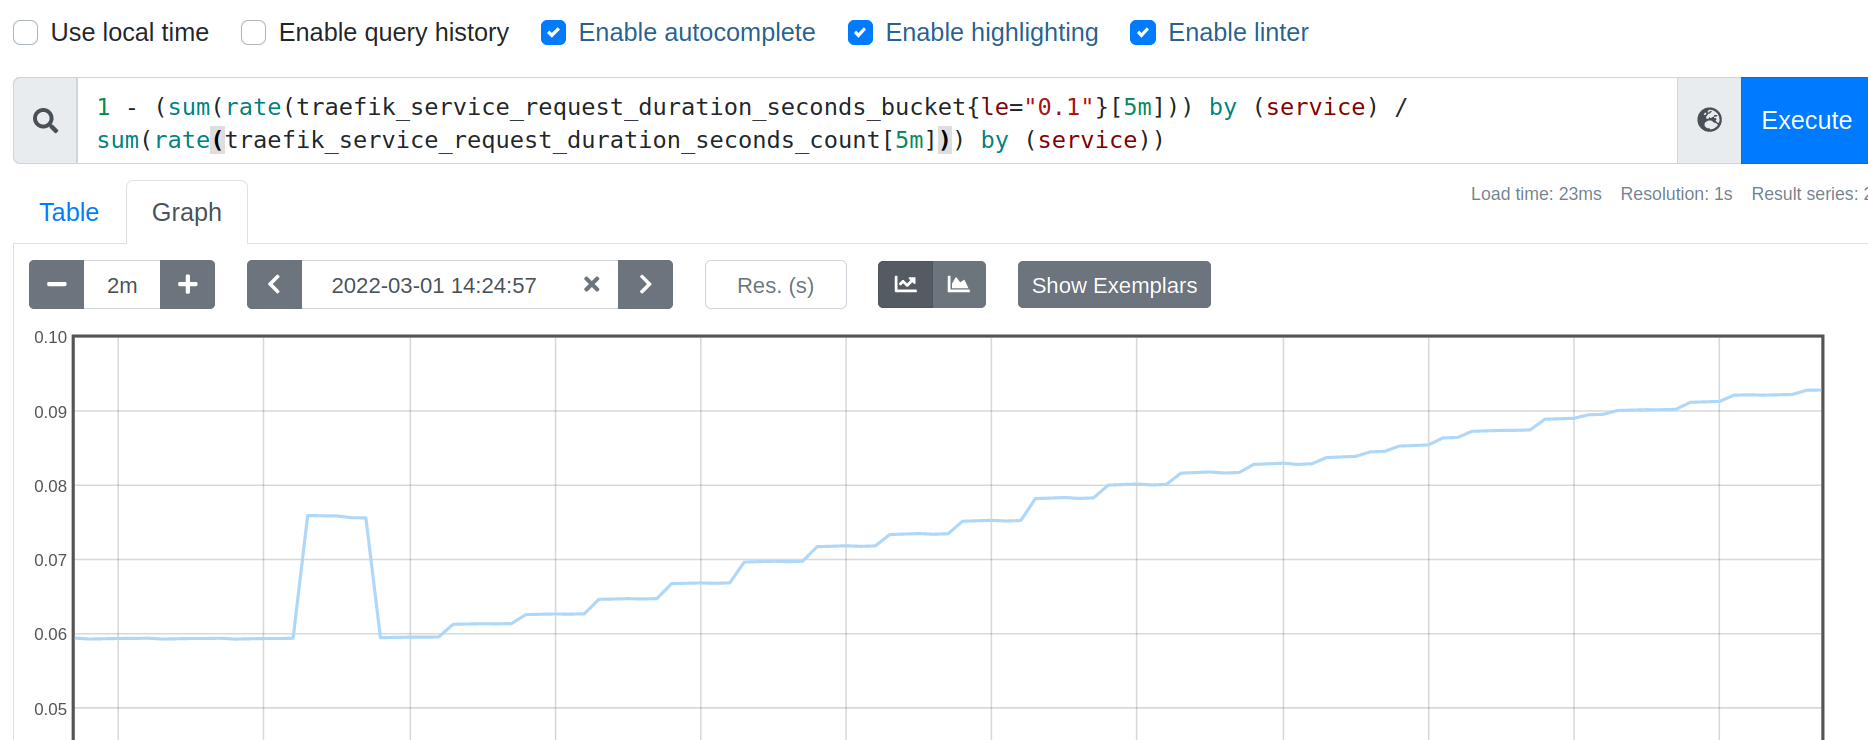
Around 9% of request durations missed a SLO of 100ms:
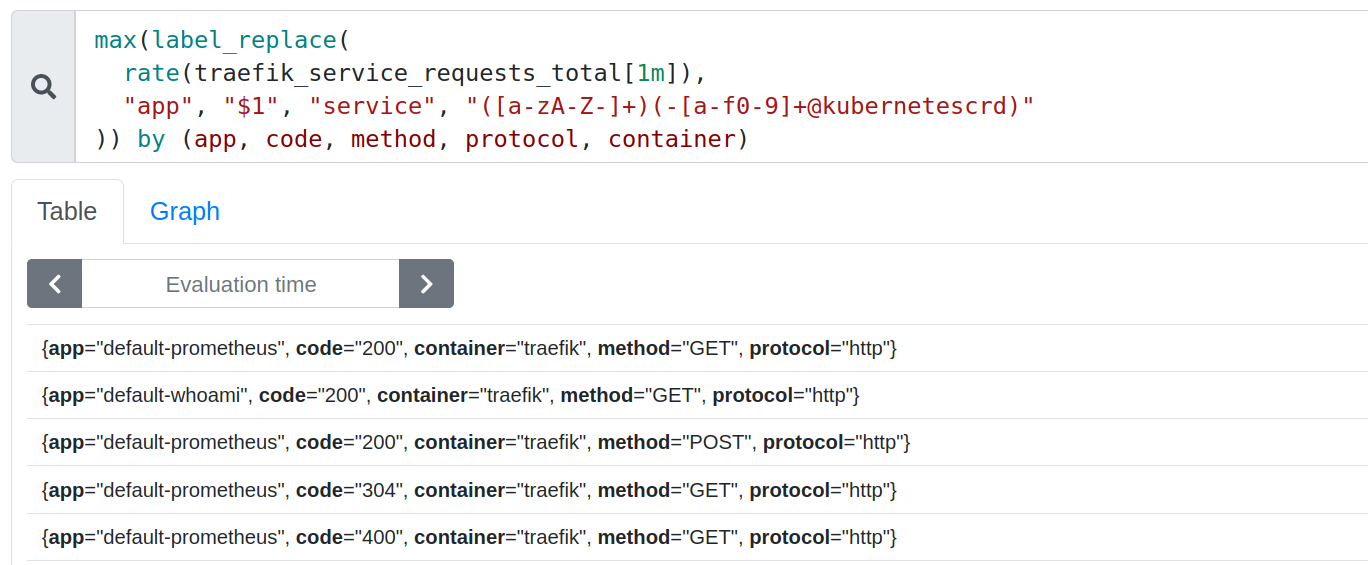
The displayed service name is not really human friendly.
You can fix that with label_replace on service to add a nicer app label.
Configure an alert on Traefik Proxy requests
To see what else Prometheus can do, let’s add a rule to raise alerts under matching conditions. Details about Prometheus rule expressions are beyond the scope of this blog post, but you can read more about it in the official Prometheus documentation.
rules:
- alert: TooManyRequests
  expr: avg(traefik_service_open_connections) > 50
  for: 1m
  labels:
    severity: critical
The above rule will raise a TooManyRequests alert if there are more than 50 open requests for 1 minute. You need to put this in a rules file, and add it to the main Prometheus server config.
$ cat metrics/prometheus-config.yaml
apiVerssion: v1
kind: ConfigMap
metadata:
  name: prometheus-config
  labels:
    name: prometheus-config
data:
  rules.yml: |-
    groups:
      - name: sre alerts on traefik
        rules:
          - alert: TooManyRequests
            expr: avg(traefik_service_open_connections) > 50
            for: 1m
            labels:
              severity: critical
  prometheus.yml: |-
    global:
      scrape_interval: 5s
      evaluation_interval: 5s
    rule_files:
      - /etc/prometheus/rules.yml

[...]
Let’s deploy this new configuration:
kubectl apply -f metrics/prometheus-config.yaml
kubectl delete pod -l app=prometheus
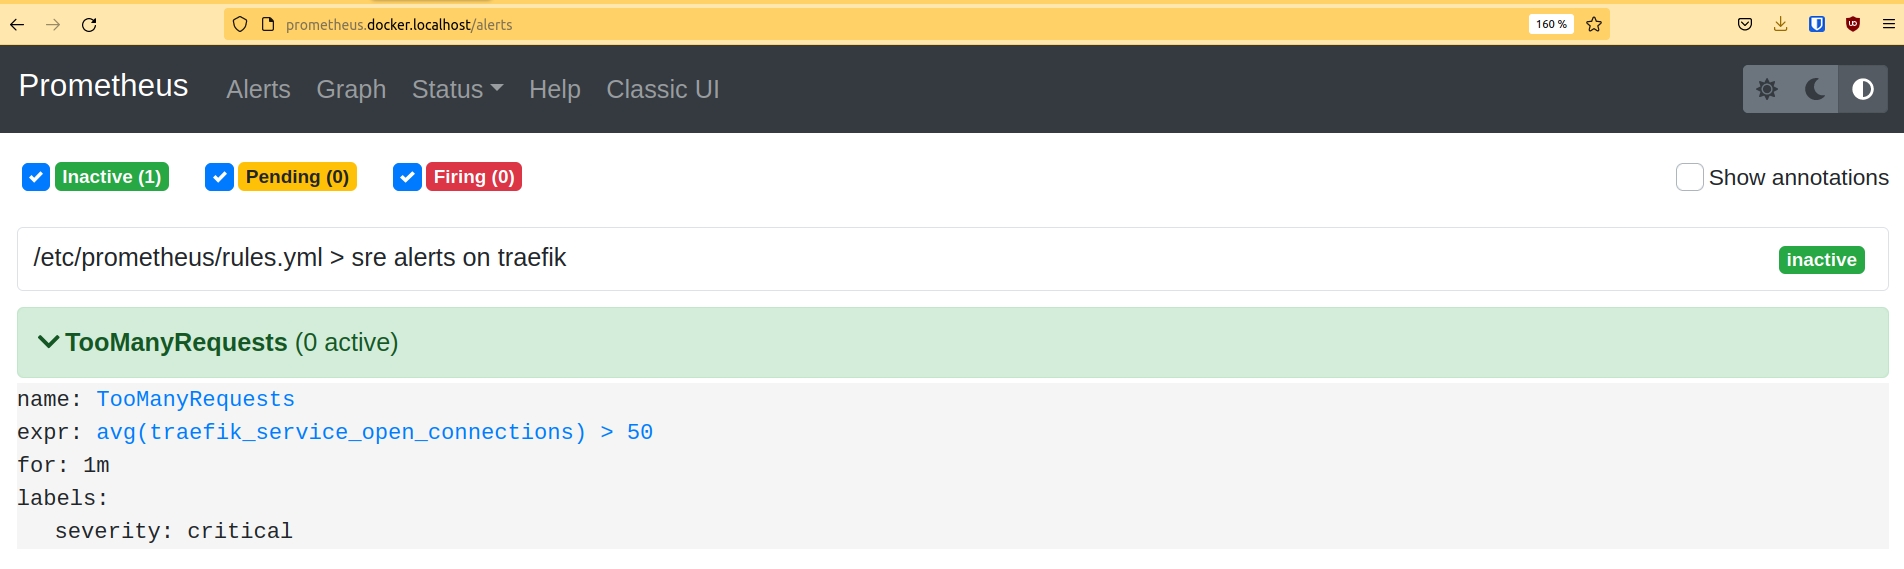
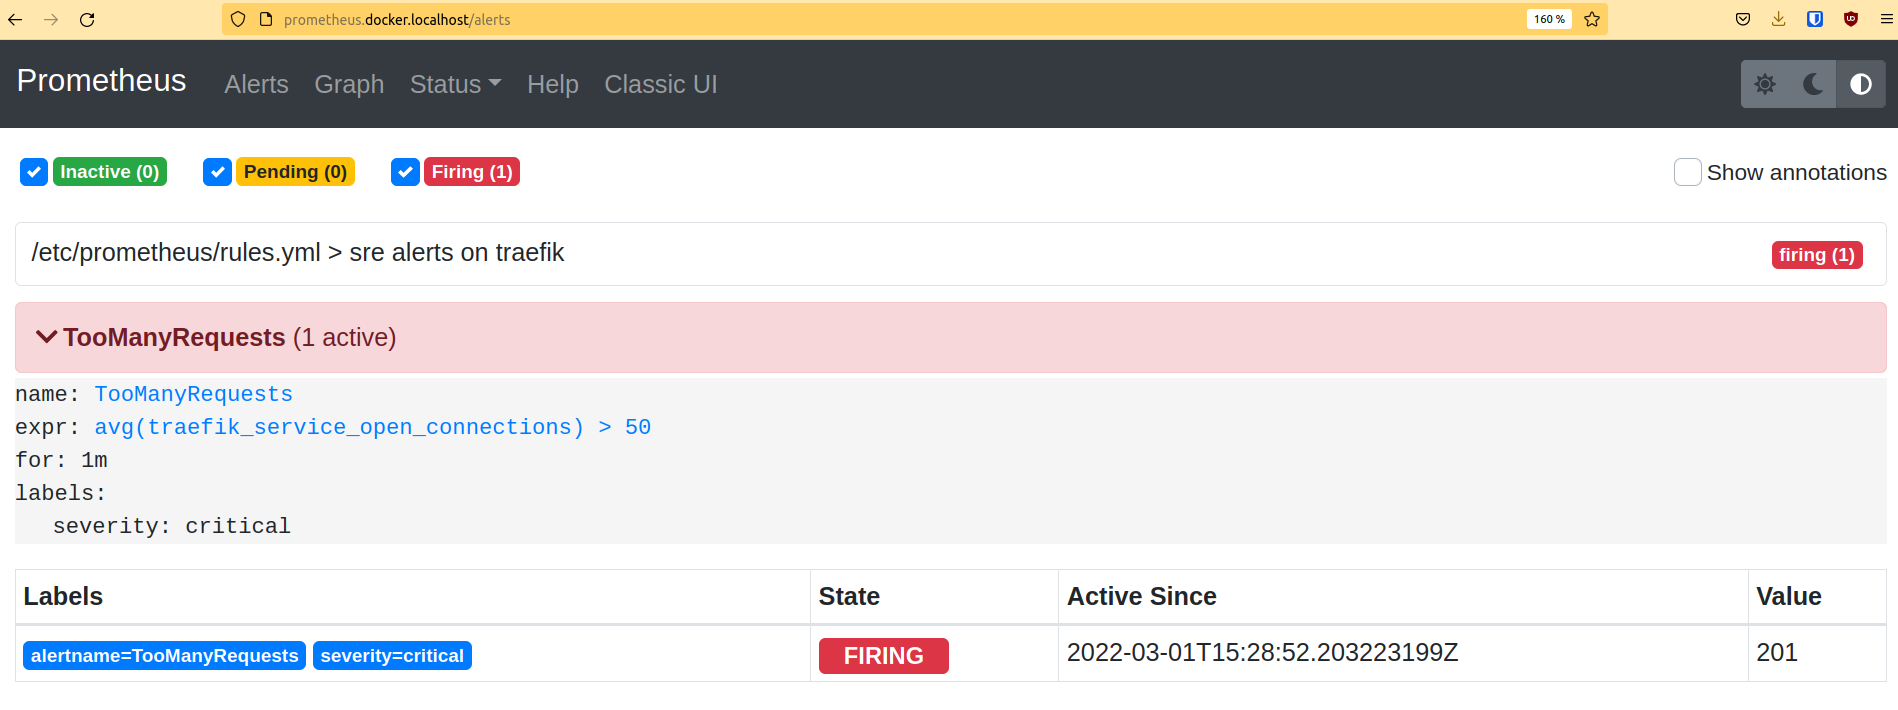
The Prometheus dashboard should show the newly created alerts in the Alerts tab (http://prometheus.docker.localhost/alerts).
Let’s raise this alert
If you relaunch the previous benchmark commands with ab:
ab -k -c 500 -n 1000000 <http://whoami.docker.localhost/>
You can see on the dashboard that the alert will go to the status of Pending.
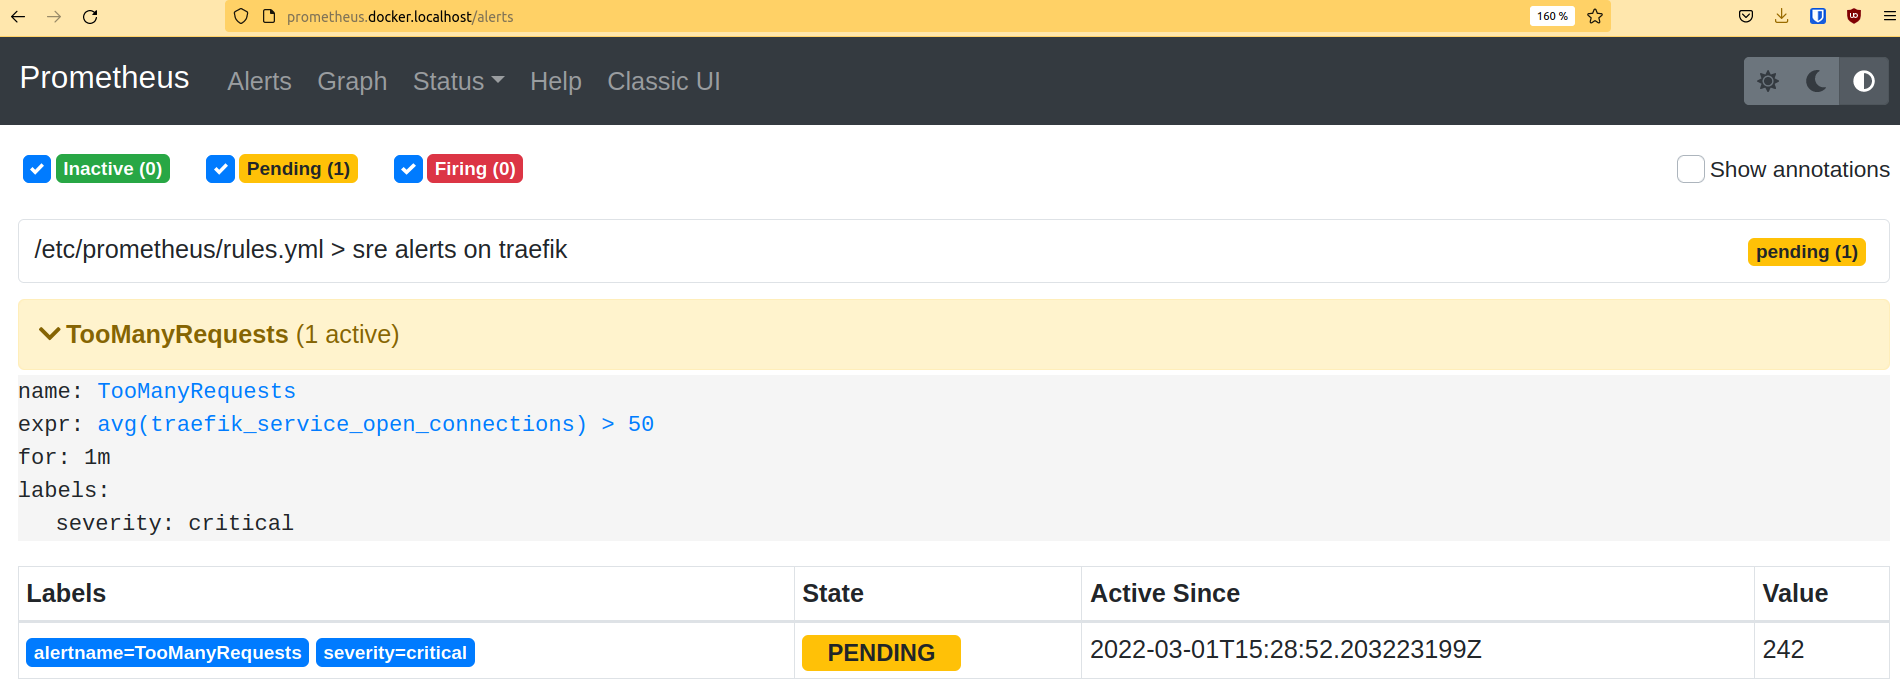
After 1 minute, its status is Firing.
If you connect the Prometheus server to the Prometheus alert manager, you will be able to manage those alerts: regroup, silence some of them, send notifications, etc. You can also connect a Grafana instance to the Prometheus datasource, in order to have a nice dashboard but that’s another story!
For the sake of simplicity, this tutorial is on default namespace with simple deployment.
In a production environment, avoid using kind and try using resources like statefulset, replicas, separate namespaces, and many others.
Note: Traefik Proxy does not currently provide metrics on pure tcp/udp connections but we are looking to add support soon.
Wrap up
The more visibility you have into the services running on your Kubernetes clusters, the better-equipped you will be to take action in the event of bad performance. In this tutorial, you've seen how easy it is to connect Traefik Proxy to Prometheus and Grafana to create visualizations from Traefik metrics.
As you familiarize yourself with these tools, you'll be able to create unique dashboards that expose the data points that are most critical for your environment.
In the third and final part of this series on SRE techniques, we focus on another open source project, Jaeger, and how to perform request tracing for applications on Kubernetes. If you'd like to learn more about gaining visibility and control over your Traefik instances, check out this webinar by Jakub Hajek.