Log Aggregation in Kubernetes with Traefik Proxy


Originally published: February 2021
Updated: December 2022
When deployed as a Kubernetes ingress controller, Traefik Proxy can process and route many thousands of requests without a complaint! And yet, for the operations team, visibility into what's happening behind the scenes is essential. Is the application healthy? Is it working as intended? Monitoring distributed systems is one of the core principles of the set of practices known as Site Reliability Engineering (SRE).
This article is the first in a series of posts on Traefik Proxy and SRE techniques that explores how Traefik's built-in logging features can help to provide visibility. When combined with a set of open source observability projects like Open Telemetry, Elastic Stack, Grafana Stack, etc., Traefik becomes part of a rich set of tools for network log analysis and visualization.

Prerequisites
If you'd like to follow along with this tutorial on your own machine, you'll need a few things first:
- A Kubernetes cluster running at localhost. One way to achieve this is to create a local cluster running in Docker containers using kind
- Helm v3.9+ installed
- The
kubectlcommand-line tool is installed and configured to access your cluster. - kind requires some config in order to use an IngressController on localhost:
$ cat kind.config
kind: Cluster
apiVersion: kind.x-k8s.io/v1alpha4
nodes:
- role: control-plane
  extraPortMappings:
  - containerPort: 30000
    hostPort: 80
    protocol: TCP
  - containerPort: 30001
    hostPort: 443
    protocol: TCP
All config files are in the public GitHub repository that accompanies this article, so you just have to clone it and create our local cluster with this network configuration:
$ git clone https://github.com/traefik-tech-blog/traefik-sre-logging/
$ cd traefik-sre-logging
$ kind create cluster --config=kind.config
$ kubectl cluster-info
$ kubectl get nodes
Note: To keep this tutorial simple, everything is deployed on the default namespace and without any kind of protection on the Traefik dashboard. On production, you should use custom namespaces and implement access control for the dashboard.
Set up Traefik Proxy
First, let’s start by deploying Traefik Proxy using the Helm chart and enabling logs. We can configure Helm chart deployment with a values file. We’ll start by just enabling access.logs. By default, they will be on stdout of the Traefik pod.
$ cat traefik-values-01.yaml
ports:
  web:
    nodePort: 30000
  websecure:
    nodePort: 30001
logs:
  access:
    enabled: true
ingressRoute:
  dashboard:
    enabled: true
    # You should protect your dashboard if it’s on the internet matchRule:
    matchRule: Host(`dashboard.docker.localhost`)
    entryPoints: ["web"]
additionalArguments:
- "--ping"
The ports with nodePort is only needed with our kind setup. Let's deploy it:
$ helm repo add traefik https://traefik.github.io/charts
$ helm install traefik -f traefik-values traefik/traefik
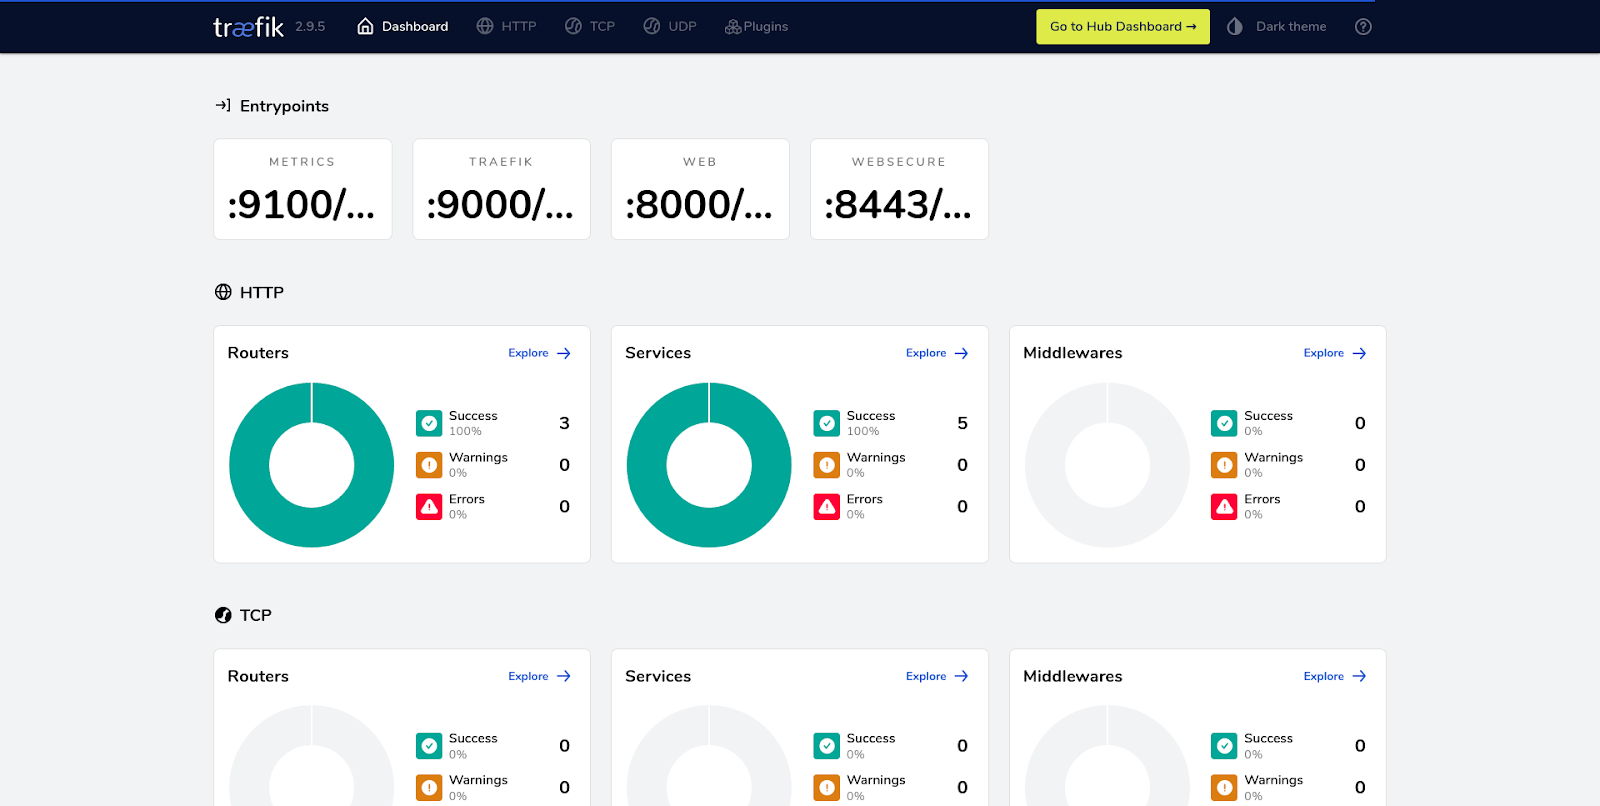
You should be able to access Traefik dashboard on the configured Host:
And to see logs on stdout of Traefik pods:
kubectl logs -f -l app.kubernetes.io/name=traefik
Deploy a sample application
For the purpose of this tutorial, I am using our sample app, whoami:
$ kubectl apply -f apps/
It can then be accessed with a browser or with curl:
$ curl http://whoami.docker.localhost
Configure logging for a collector
If you want to collect logs, you need to put those logs into a file, and often you'll also need to convert it from raw to JSON. For this, we use a local volume (emptyDir). You can change the format and set a path for access logs with those values:
--- traefik-values-01.yaml	2022-12-02 16:14:07.973877899 +0100
+++ traefik-values-02.yaml	2022-12-05 17:18:34.839234310 +0100
@@ -6,6 +6,14 @@
 logs:
   access:
     enabled: true
+    format: json
+    filePath: "/var/log/traefik/access.log"
+deployment:
+  additionalVolumes:
+  - name: logs
+additionalVolumeMounts:
+- name: logs
+  mountPath: /var/log/traefik
 ingressRoute:
   dashboard:
     enabled: true
To see the logs, we'll use a sidecar container to tail this file:
--- traefik-values-02.yaml	2022-12-05 17:18:34.839234310 +0100
+++ traefik-values-03.yaml	2022-12-05 17:21:47.387319123 +0100
@@ -9,6 +9,13 @@
     format: json
     filePath: "/var/log/traefik/access.log"
 deployment:
+  additionalContainers:
+  - name: tail-accesslogs
+    image: busybox
+    args: [ "/bin/sh", "-c", "tail -n+1 -F /var/log/traefik/access.log" ]
+    volumeMounts:
+    - name: logs
+      mountPath: /var/log/traefik
   additionalVolumes:
   - name: logs
 additionalVolumeMounts:
Instead of tail, you can, of course, use a log collector. After applying it, we can see logs in JSON format on the tail-accesslogs sidecar:
$ helm upgrade -i -f traefik-values-03.yaml traefik traefik/traefik
$ kubectl logs -f -l app.kubernetes.io/name=traefik -c tail-accesslogs
You should see all current fields of ping requests:
{
  "ClientAddr": "10.244.0.1:41388",
  "ClientHost": "10.244.0.1",
  "ClientPort": "41388",
  "ClientUsername": "-",
  "DownstreamContentSize": 2,
  "DownstreamStatus": 200,
  "Duration": 34633,
  "OriginContentSize": 2,
  "OriginDuration": 7325,
  "OriginStatus": 200,
  "Overhead": 27308,
  "RequestAddr": "10.244.0.13:9000",
  "RequestContentSize": 0,
  "RequestCount": 64,
  "RequestHost": "10.244.0.13",
  "RequestMethod": "GET",
  "RequestPath": "/ping",
  "RequestPort": "9000",
  "RequestProtocol": "HTTP/1.1",
  "RequestScheme": "http",
  "RetryAttempts": 0,
  "RouterName": "ping@internal",
  "StartLocal": "2022-12-05T16:25:29.38659907Z",
  "StartUTC": "2022-12-05T16:25:29.38659907Z",
  "entryPointName": "traefik",
  "level": "info",
  "msg": "",
  "time": "2022-12-05T16:25:29Z"
}
Add headers to access.logs
As you can see and, aligned with the documentation, there is no header by default. Let's try to add an HTTP header to those access.logs:
--- traefik-values-03.yaml	2022-12-05 17:21:47.387319123 +0100
+++ traefik-values-04.yaml	2022-12-05 17:42:44.140244962 +0100
@@ -8,6 +8,9 @@
     enabled: true
     format: json
     filePath: "/var/log/traefik/access.log"
+    fields:
+      headers:
+        defaultmode: keep
 deployment:
   additionalContainers:
   - name: tail-accesslogs
Apply the change:
$ helm upgrade -i -f traefik-values-04.yaml traefik traefik/traefik
$ kubectl logs -f -l app.kubernetes.io/name=traefik -c tail-accesslogs
And see headerfields on the sidecar container, prefixed with request:
{
  [...],
  "request_Accept": "*/*",
  "request_Connection": "close",
  "request_User-Agent": "kube-probe/1.25",
  "request_X-Forwarded-Host": "10.244.0.16:9000",
  "request_X-Forwarded-Port": "9000",
  "request_X-Forwarded-Proto": "http",
  "request_X-Forwarded-Server": "traefik-b6b999947-wb5lw",
  "request_X-Real-Ip": "10.244.0.1"
}
Protect sensitive header
Now let's say that we want to:
- Check that
Authorizationheader with a token is here, but without writing this sensitive value. - Drop Accept and Connection fields
--- traefik-values-04.yaml	2022-12-05 17:42:44.140244962 +0100
+++ traefik-values-05.yaml	2022-12-05 17:56:34.397503223 +0100
@@ -11,6 +11,10 @@
     fields:
       headers:
         defaultmode: keep
+        names:
+          Accept: drop
+          Connection: drop
+          Authorization: redact
 deployment:
   additionalContainers:
   - name: tail-accesslogs
After applying it:
$ helm upgrade -i -f traefik-values-05.yaml traefik traefik/traefik
$ kubectl logs -f -l app.kubernetes.io/name=traefik -c tail-accesslogs
And after sending a request with the Authorization header:
curl -X GET "http://whoami.docker.localhost" -H "Authorization: Bearer Thiswontbeintheaccesslogs"
We can see the new format, with sensitive the Authorization header redacted:
{
  [...],
  "origin_Accept-Ranges": "bytes",
  "origin_Content-Length": "3124",
  "origin_Content-Security-Policy": "frame-src self https://traefik.io https://*.traefik.io;",
  "origin_Content-Type": "text/html; charset=utf-8",
  "request_Authorization": "REDACTED",
  "request_User-Agent": "curl/7.74.0",
  "request_X-Forwarded-Host": "dashboard.docker.localhost",
  "request_X-Forwarded-Port": "80",
  "request_X-Forwarded-Proto": "http",
  "request_X-Forwarded-Server": "traefik-74d455649f-ndhcj",
  "request_X-Real-Ip": "10.244.0.1"
}
And there are also new origin headers sent by Curl with our test.
Timezone and buffering
Now, let's try to change the timezone and use the buffering feature to increase performance.
--- traefik-values-05.yaml	2022-12-05 17:56:34.397503223 +0100
+++ traefik-values-06.yaml	2022-12-06 09:27:12.536753905 +0100
@@ -8,6 +8,7 @@
     enabled: true
     format: json
     filePath: "/var/log/traefik/access.log"
+    bufferingSize: 1000
     fields:
       headers:
         defaultmode: keep
@@ -15,6 +16,9 @@
           Accept: drop
           Connection: drop
           Authorization: redact
+env:
+- name: TZ
+  value: "Brazil/East"
 deployment:
   additionalContainers:
   - name: tail-accesslogs
Apply it like the other changes:
$ helm upgrade -i -f traefik-values-06.yaml traefik traefik/traefik
$ kubectl logs -f -l app.kubernetes.io/name=traefik -c tail-accesslogs
And see the difference in timezones:
{
  [...],
  "StartLocal": "2022-12-06T05:29:15.353148769-03:00",
  "StartUTC": "2022-12-06T08:29:15.353148769Z",
  "time": "2022-12-06T05:29:15-03:00"
}
StartLocal and time are using the Brazil/East timezone, which is UTC-3.
For the buffering, we can see on a simple load test that Traefik Proxy can handle +16% more traffic:
$ # Before bufferingSize
$ ab -n 10000 -C 100 http://whoami.docker.localhost/
[...]
Requests per second:    1448.70 [#/sec] (mean)
$ # After applying bufferingSize to 1000
Requests per second:    1687.53 [#/sec] (mean)
Summary
This simple tutorial serves to demonstrate Traefik's comprehensive logging capabilities. You can really tailor Traefik Proxy logs before collecting them. It's a powerful tool for understanding the health and performance of services running on Kubernetes clusters.
In the next two articles of this series, I will cover the other two legs of observability: metrics and tracing, used with OpenTelemetry, Prometheus, and many others.
- Part II: Capture Traefik Metrics for Apps on Kubernetes with Prometheus
- Part III: Distributed Tracing with Traefik and Jaeger on Kubernetes
As usual, if you love Traefik Proxy and there are features you'd like to see in future releases, open a feature request or get in touch with other community members on our Forum. And if you'd like to dig deeper into how your Traefik Proxy instances operate, check out Traefik Hub, our Cloud Native networking platform.


