Rate limiting on Kubernetes applications with Traefik Proxy and Codefresh
PS: There's more! Head over to our latest article on this topic.
If you're already using Kubernetes and you're looking to get a better understanding of rate limiting you're in the right place.
Here’s a summary of what I cover in this article:
- How to install Traefik Proxy on a Kubernetes cluster.
- How to create Ingress Routes for applications in different paths.
- How to apply rate limits using Traefik Proxy Middleware.
- How to deploy your applications automatically with Codefresh.
- How to perform load testing against your cluster.
But before we jump in, let's start with the basics.
What is rate limiting?
Rate limiting is a technique for controlling the rate of requests to your application. It can save you from Denial-of-Service (DoS) or resource starvation problems.
Applying rate limits to your application ensures that, at least, a subset of your users will be able to access your service. Without rate limits, a burst of traffic could bring down the whole service making it unavailable for everybody.
I strongly advise you to apply rate limits in production environments but it is also very common to rate limit QA and testing environments.
Traefik Proxy supports rate limiting natively via the RateLimit Middleware, so applying rate limits in Kubernetes applications is a straightforward process if you already use Traefik Proxy as an ingress controller.
Rate limits for different environments
Our example application is deployed in two environments: production and QA. The production environment is deployed on a Kubernetes cluster ready to serve real traffic, including associated services—such as databases (DB), queues, etc. The QA environment is strictly used for feature testing and has much fewer resources than the production one.
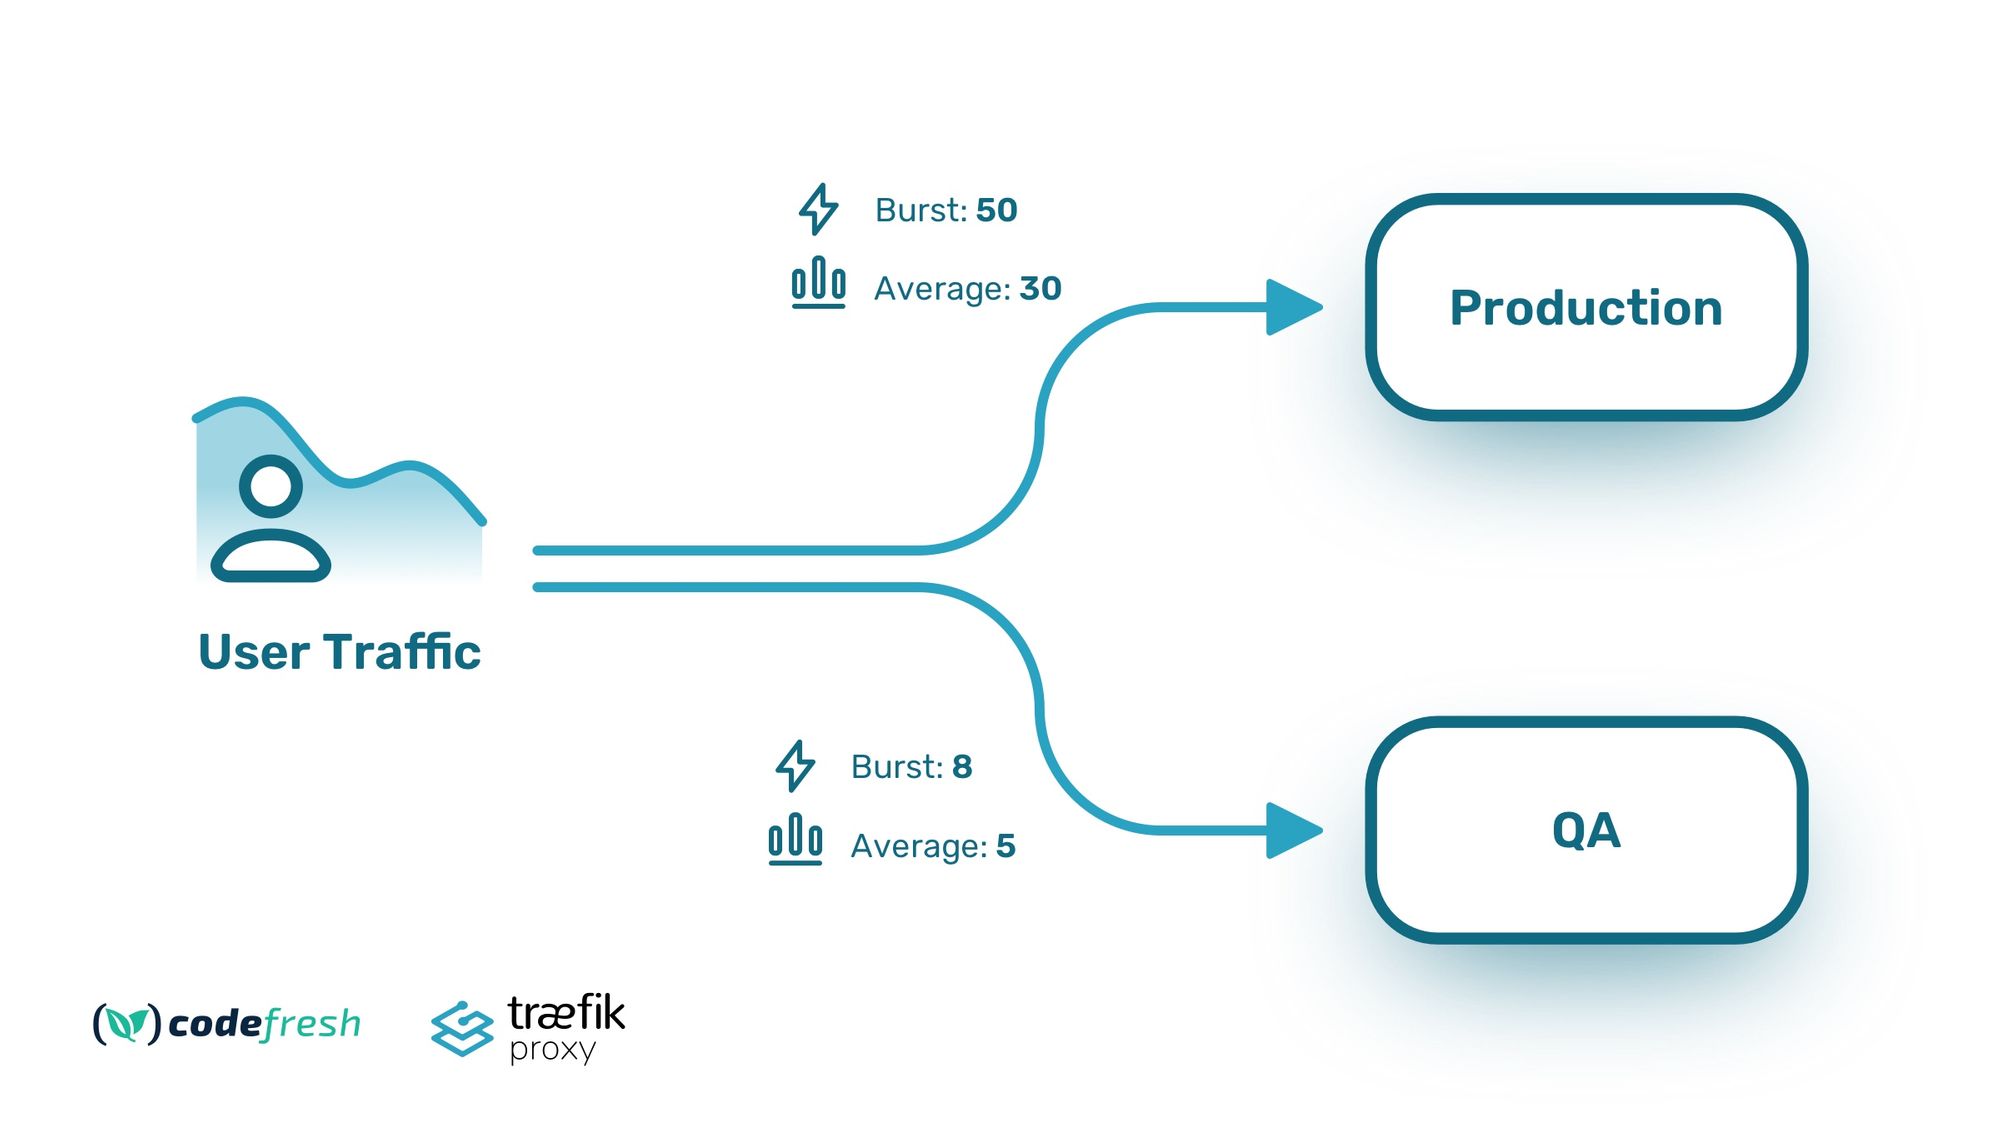
We, therefore, decide the following limits:
- Production, burst traffic 50 rps, average 30 rps
- QA, burst traffic 8 rps, average 5 rps
Let’s see how we can accomplish this with Traefik Proxy.
Using Traefik Proxy as a Kubernetes Ingress
Traefik Proxy works with multiple platforms but, in our case, we will assume that our application will be deployed to Kubernetes and more specifically to two different namespaces—one for production and one for QA. In a real deployment, your production workloads should always be on a separate cluster, but for simplicity reasons, we will use a single cluster.
Installing Traefik Proxy on Kubernetes is a straightforward process as there is already a Helm package available on GitHub.
Get access to a terminal with kubectl and Helm that is already authenticated against your cluster, and run it:
helm repo add traefik https://helm.traefik.io/traefik
kubectl create ns traefik
helm install --namespace=traefik traefik traefik/traefik
This installs traefik as an ingress controller on the cluster on its own namespace. You can get the external IP with the kubectl get svc -n traefik command and either use it as is or create DNS records for it. In our example, I have already assigned the IP to the custom domain kostis-eu.sales-dev.codefresh.io.
Defining routes for your Kubernetes applications
Traefik Proxy natively supports the Ingress specification of Kubernetes and automatically honors any ingress objects you create on the cluster. This is fine for basic cases, but adding extra annotations on all the ingresses is a cumbersome process.
An alternative method is to use custom Kubernetes resources (CRDs) that are fully managed by Traefik Proxy. Using declarative files for Traefik Proxy is also a great idea if you are following GitOps and deploy your infrastructure with tools such as ArgoCD.
Note that by installing Traefik Proxy via Helm, all needed CRDs are included in the installation, so we can use them right away.
First, we need a way to expose each application to its own URL. We want to use /prod for the production deployment and /qafor the QA deployment.
Traefik Proxy accomplishes this with an IngressRoute Object:
apiVersion: traefik.containo.us/v1alpha1
kind: IngressRoute
metadata:
  name: prod-route
spec:
  entryPoints:
    - web
  routes:
  - match: PathPrefix(`/prod`)
    kind: Rule
    services:
    - name: prod-service
      port: 80
This definition says that whenever somebody accesses the Kubernetes cluster using the /prod URL path, Traefik proxy uses a Kubernetes service called prod-service at port 80. We also have a similar definition for the QA environment here.
We can test this route by deploying the application manually:
git clone https://github.com/kostis-codefresh/traefik-rate-limit-demo
cd traefik-rate-limit-demo/manifests-qa
kubectl create ns qa
kubectl apply -f . -n qa
```
And then visit the /qa URL in your browser. You should see the example application running:
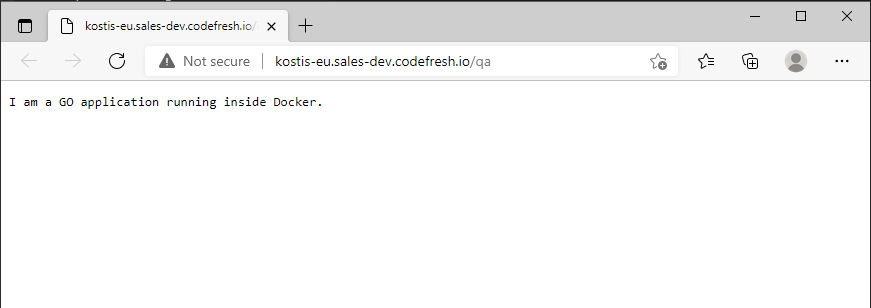
This takes care of basic routing. Next, let’s handle rate limiting.
Applying rate limiting to different routes
For rate limits, Traefik Proxy has another custom object that defines the limits in a generic way:
apiVersion: traefik.containo.us/v1alpha1
kind: Middleware
metadata:
  name: prod-rate-limit
spec:
  rateLimit:
    average: 30
    burst: 50
Middlewares in Traefik Proxy are networking filters that modify further a request or inspect it in a special way. See the overview of Traefik Proxy concepts if you want to dive further into how Traefik deals with requests.
Here we define our production rate limit specifying average and burst thresholds. Keep in mind that Traefik Proxy has several more options for rate limiting. See the official documentation for more details.
The last step is to actually connect this middleware with a service. We accomplish this by extending our ingress route with a new middleware property:
apiVersion: traefik.containo.us/v1alpha1
kind: IngressRoute
metadata:
  name: prod-route
spec:
  entryPoints:
    - web
  routes:
  - match: PathPrefix(`/prod`)
    kind: Rule
    services:
    - name: prod-service
      port: 80
    middlewares:
      - name: prod-rate-limit
We also do the same thing for the QA limit and the QA route. Rate limiting is now set up for both QA and production environments.
Deploy Kubernetes applications with Codefresh
To test rate limiting, we could again use kubectl to manually install everything in our cluster. It is much better, however, to fully automate the process. In this example, we use Codefresh, a deployment platform specifically for Kubernetes applications.
First, we need to connect our Kubernetes cluster to our Codefresh account.
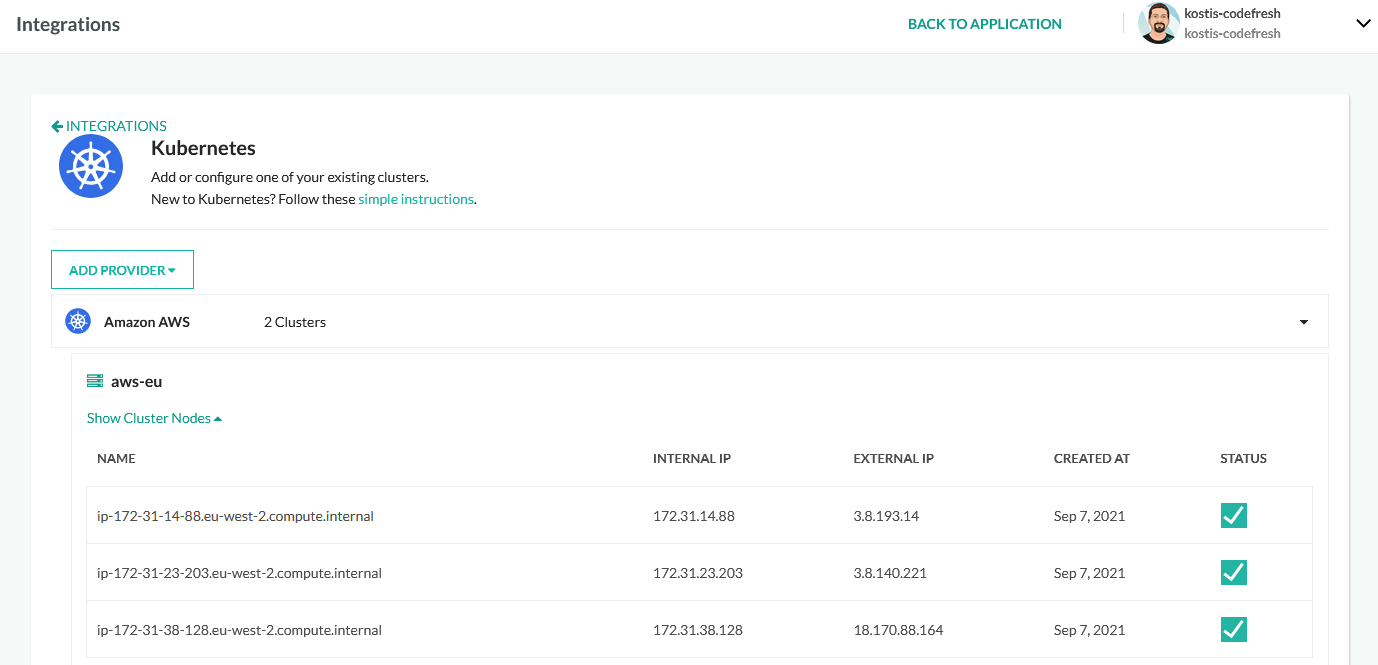
This cluster is now available in all pipelines with the name aws-eu. Next, we can create a Dockerhub account and connect this globally as well:
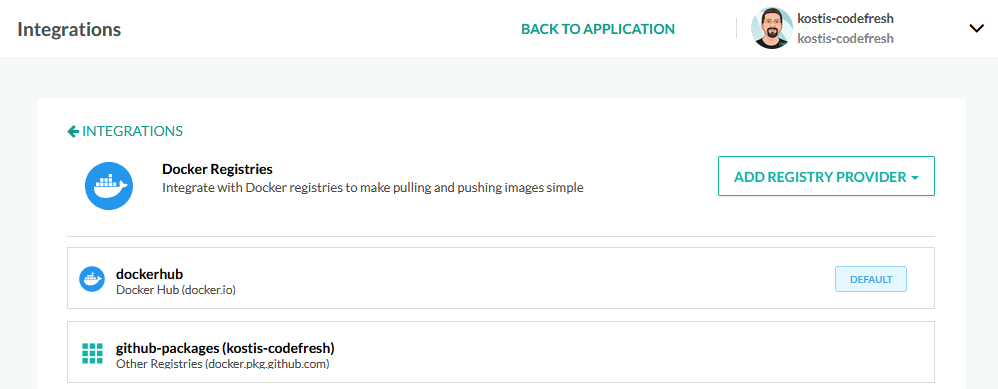
The Dockerhub account is available, as dockerhub, to all pipelines.
For our example with the two environments, we create the following pipeline:
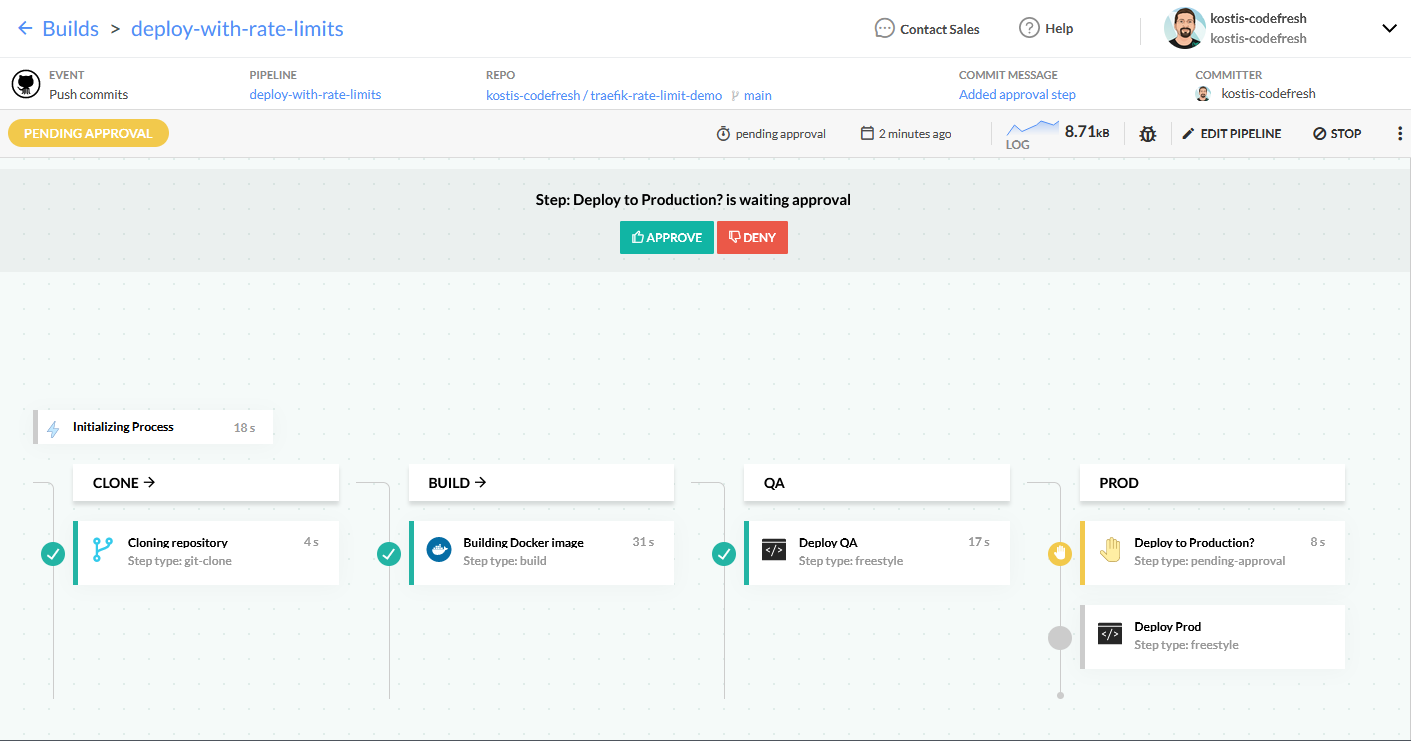
This pipeline does the following:
- checks out the source code of the application
- builds the docker image of the application
- pushes the docker image to Dockerhub
- deploys the application to the QA environment (and also applies the Traefik Proxy rate limits)
At this point, the pipeline stops and waits for manual approval before deploying to production. You can find more information about Codefresh pipelines in the documentation of pipeline steps.
Here is the whole pipeline source:
version: "1.0"
stages:
  - "clone"
  - "build"
  - "qa"
  - "prod"

steps:
  clone:
    title: "Cloning repository"
    type: "git-clone"
    repo: "kostis-codefresh/traefik-rate-limit-demo"
    revision: '${{CF_REVISION}}'
    stage: "clone"

  build:
    title: "Building Docker image"
    type: "build"
    image_name: "kostiscodefresh/traefik-demo-app"
    working_directory: "${{clone}}/simple-web-app"
    tags:
    - "latest"
    - '${{CF_SHORT_REVISION}}'
    dockerfile: "Dockerfile"
    stage: "build"
    registry: dockerhub
  qa_deployment:
    title: Deploy QA
    stage: qa
    image: codefresh/cf-deploy-kubernetes:master
    working_directory: "${{clone}}"
    commands:
      - /cf-deploy-kubernetes ./manifests-qa/deployment.yml
      - /cf-deploy-kubernetes ./manifests-qa/service.yml
      - /cf-deploy-kubernetes ./manifests-qa/qa-rate-limit.yml
      - /cf-deploy-kubernetes ./manifests-qa/route.yml
    environment:
      - KUBECONTEXT=aws-eu
      - KUBERNETES_NAMESPACE=qa
    env:
      name: Traefik-QA
      endpoints:
      - name: Main
        url: http://kostis-eu.sales-dev.codefresh.io/qa
      type: kubernetes
      change: '${{CF_COMMIT_MESSAGE}}'
      filters:
      - cluster: aws-eu
        namespace: qa
  askForPermission:
    type: pending-approval
    title: Deploy to Production?
    stage: prod
  prod_deployment:
    title: Deploy Prod
    stage: prod
    image: codefresh/cf-deploy-kubernetes:master
    working_directory: "${{clone}}"
    commands:
      - /cf-deploy-kubernetes ./manifests-prod/deployment.yml
      - /cf-deploy-kubernetes ./manifests-prod/service.yml
      - /cf-deploy-kubernetes ./manifests-prod/prod-rate-limit.yml
      - /cf-deploy-kubernetes ./manifests-prod/route.yml
    environment:
      - KUBECONTEXT=aws-eu
      - KUBERNETES_NAMESPACE=prod
    env:
      name: Traefik-Prod
      endpoints:
      - name: Main
        url: http://kostis-eu.sales-dev.codefresh.io/prod
      type: kubernetes
      change: '${{CF_COMMIT_MESSAGE}}'
      filters:
      - cluster: aws-eu
        namespace: prod
Now that the pipeline is waiting for manual approval, you have the opportunity to inspect and run unit tests on the QA environment before approving the creation of the production application.
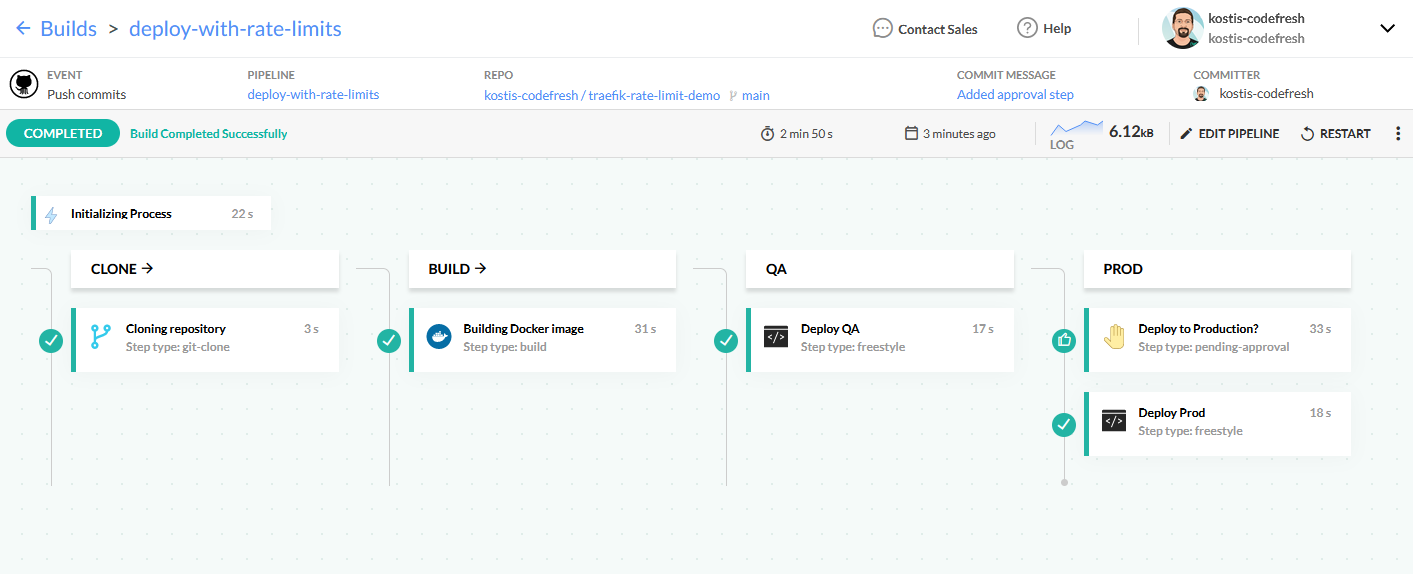
Deployment is now finished in both environments. Let’s verify them.
Inspecting your Kubernetes applications
There are many ways to inspect your applications. The simplest one is to visit the Codefresh dashboard:
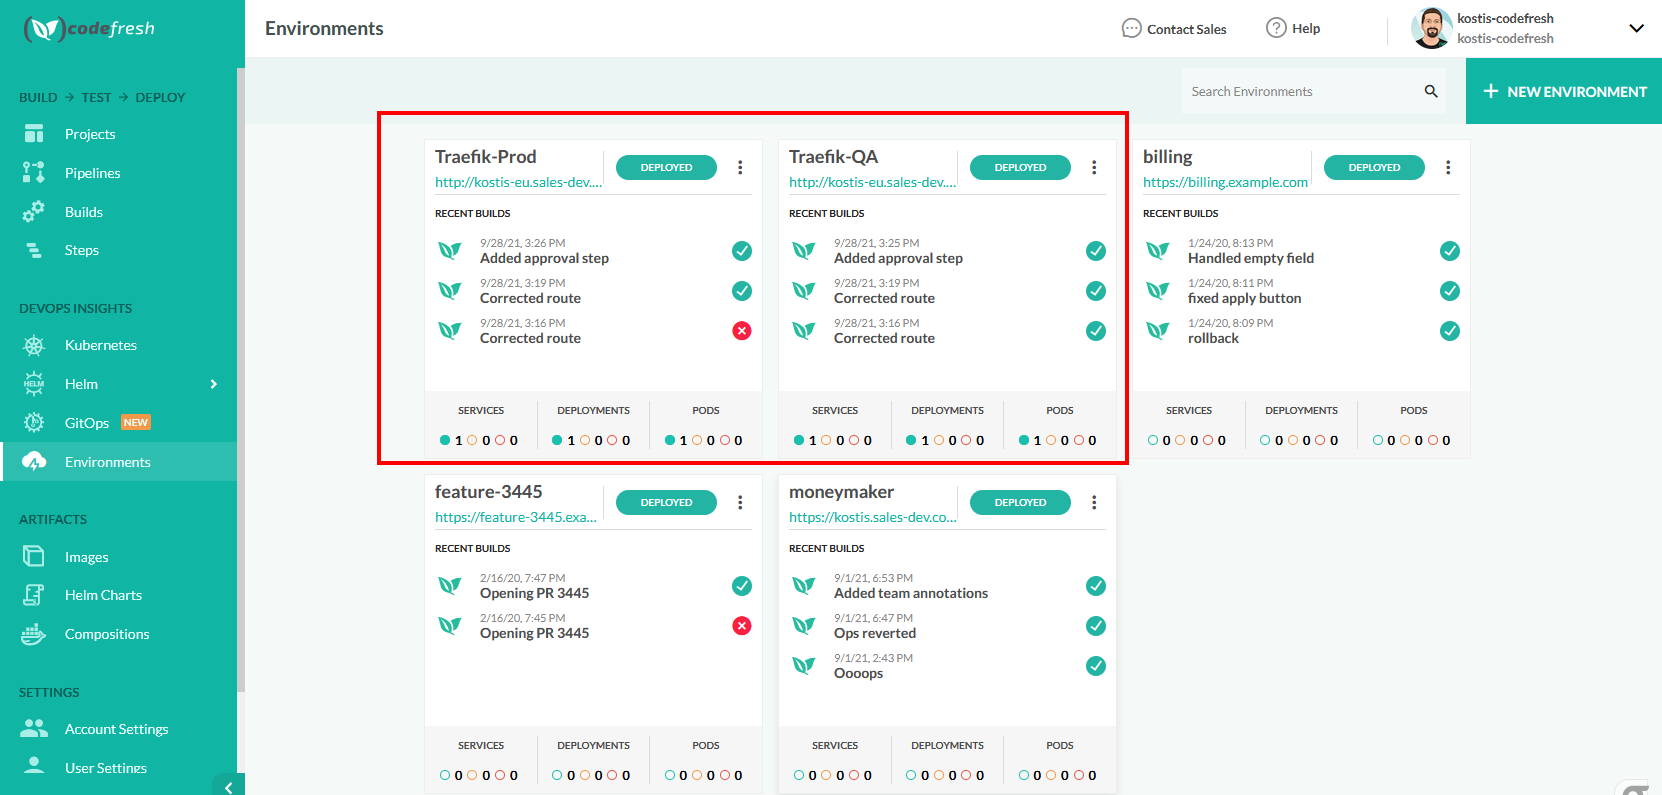
Here you can see both environments, along with a quick health check of services/deployments/pods. Everything looks healthy. You can also click on each environment and get a list of the builds that affected it.
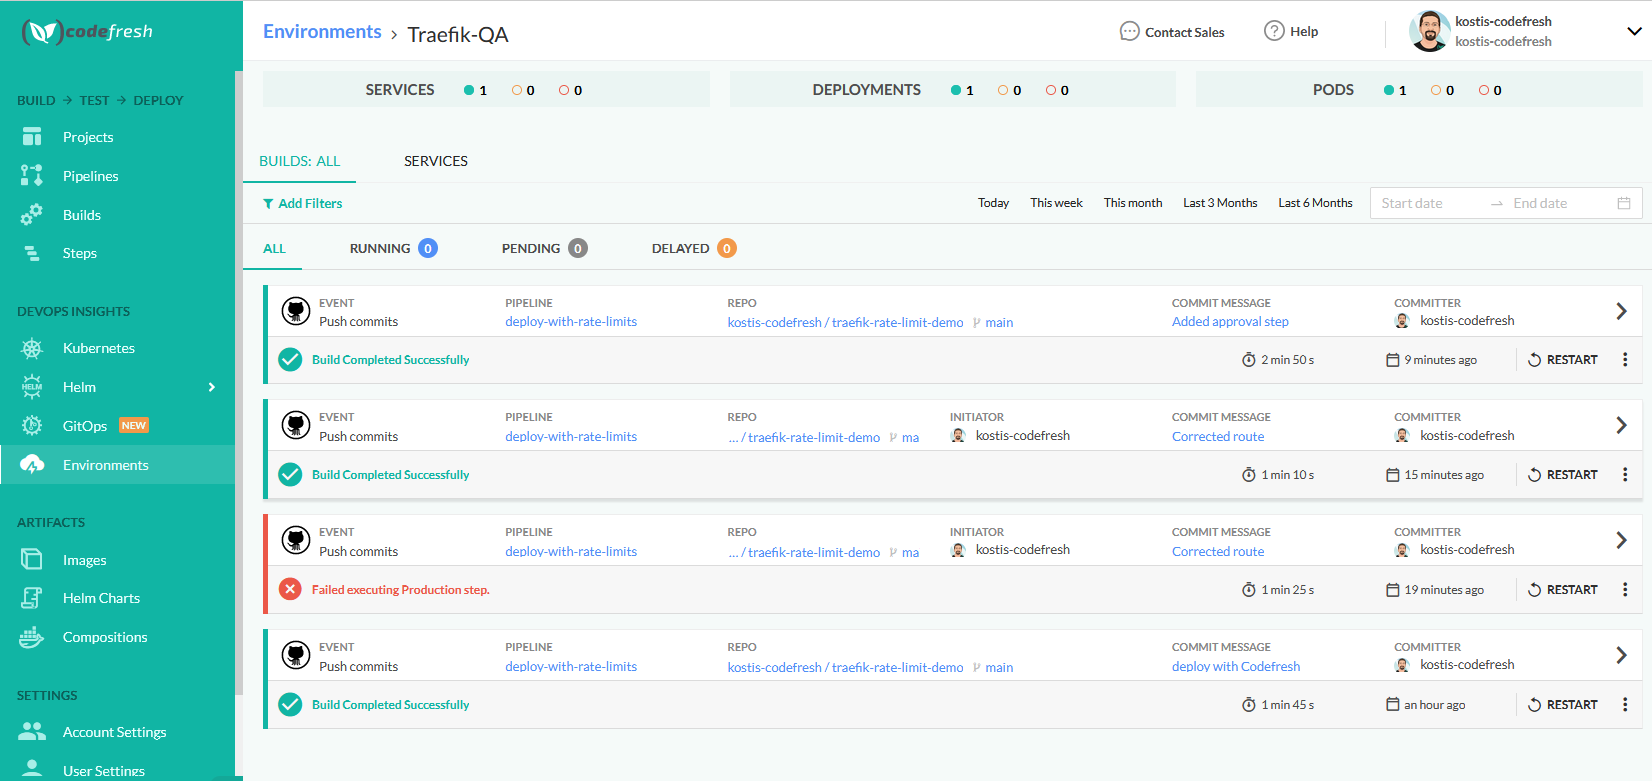
Alternatively, you can use kubectl from the command line to see what the application is doing:
~/workspace/traefik-rate-limit-demo$ kubectl get all -n qa
NAME                             	READY   STATUS	RESTARTS   AGE
pod/qa-deployment-5976d94cbd-ch87d   1/1 	Running   0      	63m

NAME             	TYPE    	CLUSTER-IP   	EXTERNAL-IP   PORT(S)   AGE
service/qa-service   ClusterIP   10.100.108.147   <none>    	80/TCP	62m

NAME                        	READY   UP-TO-DATE   AVAILABLE   AGE
deployment.apps/qa-deployment   1/1 	1        	1       	63m

NAME                                   	DESIRED   CURRENT   READY   AGE
replicaset.apps/qa-deployment-5976d94cbd   1     	1     	1   	63m
The deployment has finished successfully. The last step is to test the rate limits.
Verifying Traefik Proxy rate limits
To check that everything is deployed successfully, we can run load testing in both environments and see the different rate limits. There are several tools for this purpose that you can use:
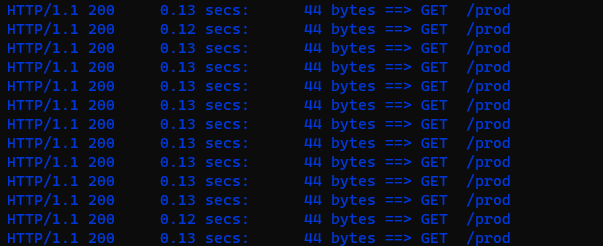
We have selected Siege for our scenario. Let’s test the production environment first:
siege -c 10 -r 20 http://kostis-eu.sales-dev.codefresh.io/prod
This runs a test of 10 users for 20 runs. The production environment should handle this traffic with no problem and indeed all requests are successful:
Let’s try the same thing on QA:
siege -c 10 -r 20 http://kostis-eu.sales-dev.codefresh.io/qa
Remember that for the QA environment we have defined a burst number of 8 and average requests of 5. So, handling 10 users will be an issue. Indeed, after the initial requests succeed, we get many that failed:
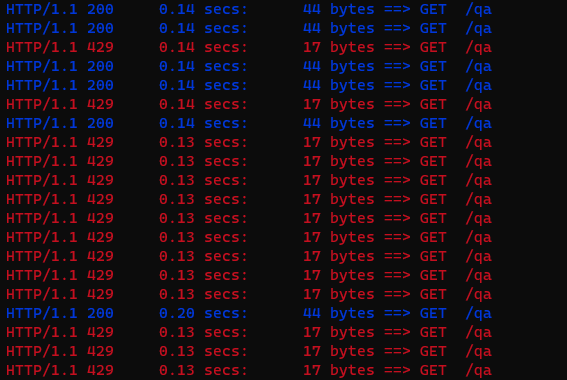
The HTTP error code 429 is for Too Many Requests. This is what Traefik Proxy does when the rate limit is reached.
While the test is running you can also run a request manually and see that Traefik Proxy also fills the X-Retry-In header.
➜  traefik-rate-limit-demo git:(main) curl  -i http://kostis-eu.sales-dev.codefresh.io/qa
HTTP/1.1 429 Too Many Requests
Retry-After: 0
X-Retry-In: 105.712425ms
Date: Tue, 28 Sep 2021 12:40:23 GMT
Content-Length: 17
Content-Type: text/plain; charset=utf-8

Too Many Requests⏎
This header suggests to the client how much time to wait before performing the request again.
Everything now works as expected. You can try different combinations of siege parameters in both environments. As an exercise, try making the production environment return HTTP 429 to your siege command.
Summing up
I hope this blog post was useful for understanding rate limits.
The full source code of the application, including the Kubernetes manifests and Traefik Proxy resources, is available here. Traefik Proxy has many more middleware modules that you can use in your application.
If this is the first time you're hearing about Traefik, download it for free to try it out yourself. Make sure to check out Codefresh and sign up for a free account.


