The Journey to Traefik Enterprise Edition: High Availability
Welcome to the third step of our journey towards Traefik Enterprise Edition .
After the two first posts, let’s get real and evaluate TraefikEE’s high availability feature.
The previous post described how to install TraefikEE on a local machine, which is not a realistic environment. Today, we’ll use a Kubernetes multi-node cluster deployed in Amazon EC2 as a more realistic platform for running TraefikEE.
Creating a Kubernetes Cluster with kops
The first step is to get a multi-node Kubernetes cluster up and running somewhere in the cloud.
kops (aka. “Kubernetes Operations”) is a tool provided by the Kubernetes community. It provides a command line to create and manage Kubernetes clusters on cloud infrastructures as Amazon EC2, Google Compute Engine or Digital Ocean.
Using the kops tutorial for AWS, we have the following requirements set up:
- The
awscommand line tool installed - AWS API access credentials loaded (check this project from Michael MATUR if you need MFA)
- The
kopscommand line tool installed - One of the 3 DNS scenarios configured
- An AWS S3 bucket created to store kops configuration
We can create a Kubernetes cluster with 3 masters and 6 worker nodes. The worker nodes are a t2.large types, with 2 CPUs and 8 Gb memory each:
$ export NAME=traefikee-demo.containous.cloud
$ export KOPS_STATE_STORE=s3://<YOUR BUCKET>
$ export ROUTE53_ZONE_ID=<ROUTE53_ZONE_ID>

$ kops create cluster \
  --zones us-east-1a \
  --dns-zone="${ROUTE53_ZONE_ID}" \
  --node-size="t2.large" \
  --master-count=3 \
  --node-count=6 \
"${NAME}"
Once the cluster is created, validate its state with kops, and verify the access to the Kubernetes API with the kubectl:
$ kops validate cluster --name="${NAME}"
Validating cluster traefikee-demo.containous.cloud
...

Your cluster traefikee-demo.containous.cloud is ready

$ kubectl get nodes
NAME STATUS ROLES AGE VERSION
ip-172–20–33–152.ec2.internal Ready node 1d v1.11.6
ip-172–20–37–195.ec2.internal Ready master 1d v1.11.6
ip-172–20–38–193.ec2.internal Ready node 1d v1.11.6
ip-172–20–42–46.ec2.internal Ready master 1d v1.11.6
ip-172–20–44–104.ec2.internal Ready node 1d v1.11.6
ip-172–20–52–184.ec2.internal Ready node 1d v1.11.6
ip-172–20–60–90.ec2.internal Ready node 1d v1.11.6
ip-172–20–61–254.ec2.internal Ready node 1d v1.11.6
ip-172–20–62–134.ec2.internal Ready master 1d v1.11.6
We can now proceed to install TraefikEE on this cluster.
TraefikEE Installation
We expect that the command line traefikeectl command is already installed on your machine. If you haven’t done it yet, check the "Install traefikeectl" section of the Installation Guide.
$ traefikeectl version
Version: v1.0.0-beta17
Codename: Gewurztraminer
Go version: go1.11.4
Built: 2019-01-22_10:12:50AM
OS/Arch: darwin/amd64
Next step: installation of TraefikEE in one line, using traefikeectl, as covered on the previous blog post.
Don’t forget it takes some time to download all the required resources
$ traefikeectl install \
  --licensekey="$(cat /keybase/…/traefikee-license)" \
  --dashboard \
  --kubernetes

# ...

You can access the dashboard with the following credentials:

Username: admin
Password: 384bae9a1fe11670

✔ Installation successful
Don’t forget to write down the password for later.
Congratulations, your TraefikEE cluster is installed locally! The last step is to check the topology of the TraefikEE cluster:
$ traefikeectl list-nodes
Name                                 Role
----                                 ----
data-node-traefikee-data-node-864tl  DATA NODE
data-node-traefikee-data-node-jptsq  DATA NODE
data-node-traefikee-data-node-rn4x8  DATA NODE
traefikee-control-node-1             CONTROL NODE
data-node-traefikee-data-node-l6x2s  DATA NODE
data-node-traefikee-data-node-wmm6n  DATA NODE
data-node-traefikee-data-node-h2pgb  DATA NODE
traefikee-control-node-2             CONTROL NODE (Current Leader)
traefikee-control-node-0             CONTROL NODE
As expected we have:
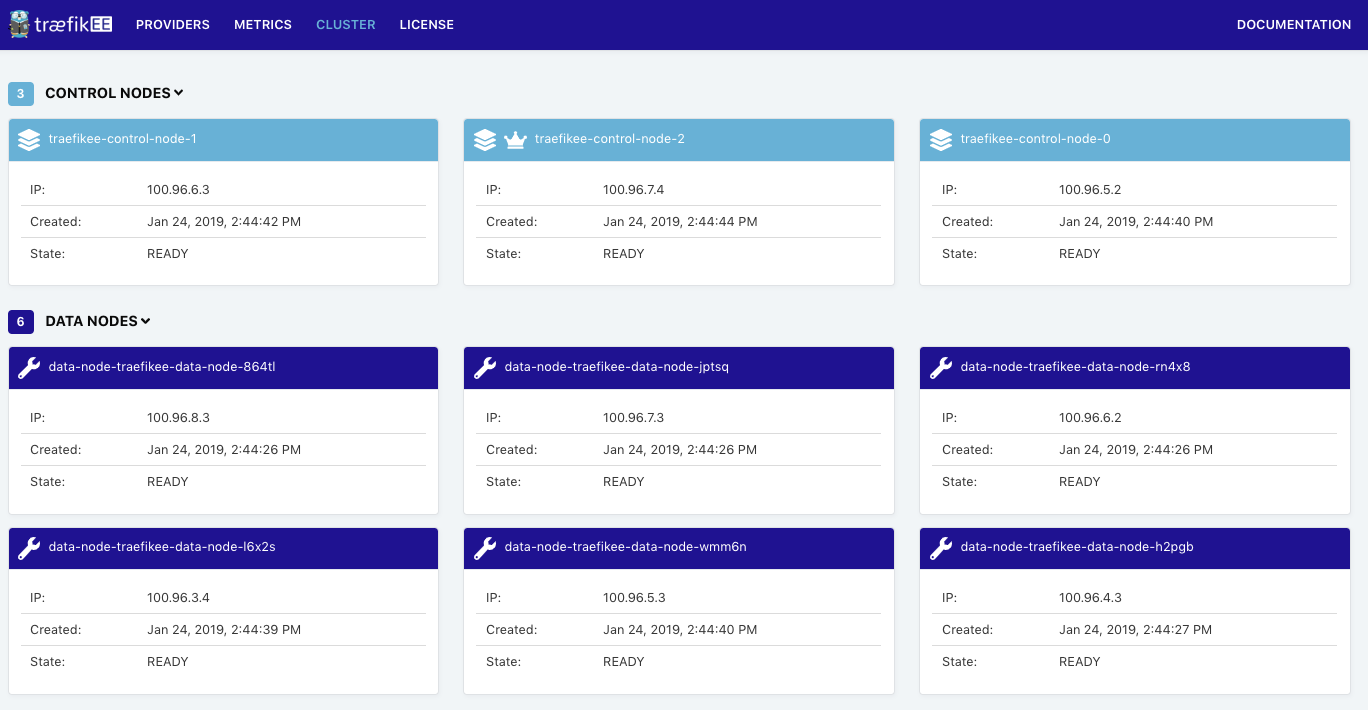
- A Control Plane composed of 3 nodes, which is the default
- A Data Plane composed of 6 nodes, which is the default behavior (see the flag “ — datanodes”) . TraefikEE sets up 1 data node per worker node of the Kubernetes cluster. It uses a Kubernetes Daemon Set under the hood.
Accessing the Web Dashboard
On the previous post, we used the kubectl port-forward command to access the dashboard by forwarding a port locally.
As this Kubernetes cluster is available from the outside, we want to use a public hostname to access it instead, so the end users can access your applications from anywhere.
Using the command line kubectl, fetch the public hostname of the Amazon Elastic Load-Balancer allocated during the installation (column EXTERNAL-IP):
$ kubectl get svc -n traefikee traefikee-lb

NAME          TYPE         EXTERNAL-IP
traefikee-lb  LoadBalancer a277b89-820.us-east-1.elb.amazonaws.com
You can now access the dashboard on the URL http://<EXTERNAL-IP>/dashboard/ .
(A voice in the background): My Kubernetes Cluster does not show any EXTERNAL-IP. How can I reach the dashboard (and applications)?
Containous: Most of Kubernetes providers propose out of the box implementation for the Service of type “LoadBalancer”. If it is not your case, take a look at https://metallb.universe.tf/.
Deploy an Application
As we did on the previous post, we deploy an application based on https://github.com/containous/whoami.
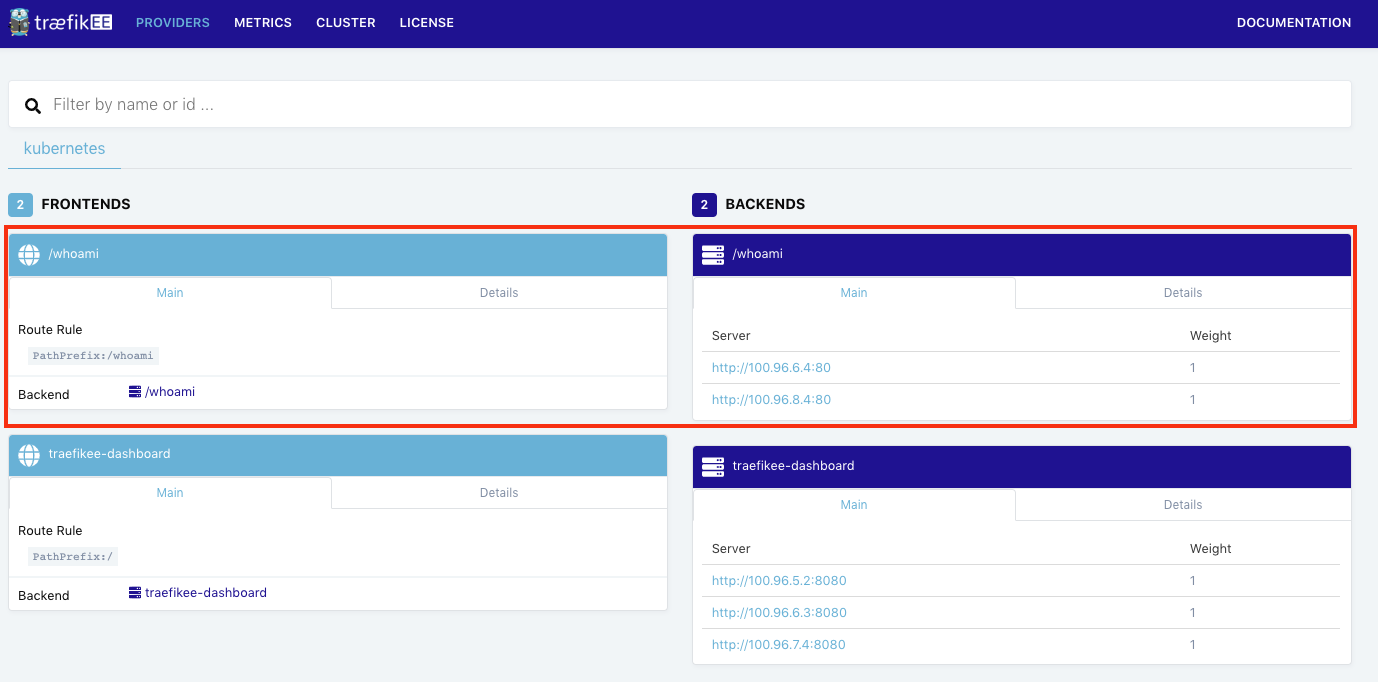
$ kubectl apply -f https://gist.githubusercontent.com/dduportal/ad5e68ffcd9e39c65bdf4af7224304a0/raw/0ff70f9ae50d7930a9fa6c06bdc15253c81b8af4/whoami.yamlThe dashboard updates itself once the application is deployed:
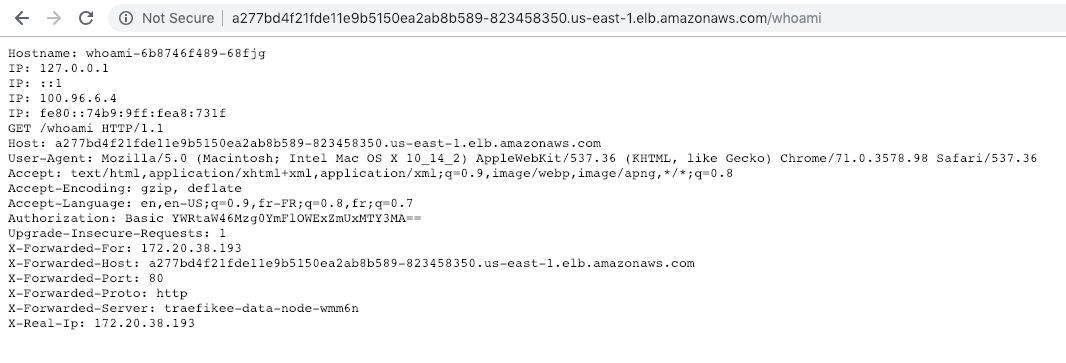
You can now reach the application at the URL http://<EXTERNAL-IP>/whoami :
High Availability
What happens if one of the 6 worker node goes down by accident or for maintenance?
- 1 of the 6 data nodes goes down (or is rescheduled). The load balancer forwards the traffic to the 5 remaining nodes: no request are lost!
- If 1 of the control nodes was running on this worker node, the remaining nodes elect a new leader and take care of the configuration, until the node comes up.
(A voice in the background): Aren’t the control node part of a Raft cluster? If yes, then what happens if only 2 control nodes are up?
Containous: The workload handled by the failed node is distributed to the 2 others, so the cluster does not loose data and continues to work as expected. However if the failed node does not comes back, then you are not tolerant to another failure. You can run a TraefikEE of 5 control nodes to be fault tolerant to 2 failures. You can get more information on the TraefikEE documentation or chek how the Raft consensus work here.
To demonstrate this high-availability behavior, we will:
- Run a load test on the “whoami” application served by TraefikEE
- Restart 1 of the 6 Kubernetes worker node
- Verify that no requests are lost
- Validate that the cluster comes back in an healthy state once the Kubernetes worker node is restarted
Load Testing the whoami Application
We’ll use “slapper” (https://github.com/ikruglov/slapper), a go command line providing a real-time view of the load test in the console.
# You need go - https://golang.org/dl/

$ go get -u github.com/ikruglov/slapper
...

$ which slapper
"${GOPATH}/bin/slapper"
Slapper requires a “target file” which is a text file describing the load-testing scenario. Our load-testing scenario is simple: we want to emit HTTP GET requests to the URL of the whoami application.
$ cat whoami.target
GET http://a277bd4f21fde11e9b5150ea2ab8b589-823458350.us-east-1.elb.amazonaws.com/whoami
Let’s start the load testing for 30s, with 50 requests per seconds, and with an adapted scale (with an example output):
$ slapper -targets ./whoami.target -minY 100ms -maxY 800ms -timeout 30s -rate 50

sent: 198    in-flight: 6  rate:   50/50 RPS responses: [200]: 192

100-101 ms: [     0/     0]
101-102 ms: [     0/     0]
102-103 ms: [     0/     0]
103-105 ms: [     0/     0]
105-106 ms: [     0/     0]
106-108 ms: [    13/     0] **************************
108-110 ms: [   112/     0] ************************************
110-113 ms: [    40/     0] ****************************************
113-115 ms: [    10/     0] ********************
115-118 ms: [     3/     0] ******
118-121 ms: [     4/     0] ********
121-125 ms: [     2/     0] ****
125-129 ms: [     0/     0]
129-133 ms: [     0/     0]
133-138 ms: [     0/     0]
138-144 ms: [     0/     0]
144-150 ms: [     0/     0]
...
800+ ms: [     0/     0]
Reboot a Worker Node
Using the aws and kubectlcommand lines, we get the EC2 instance ID of a worker node, and restart it:
# Select one of the 6 Kubernetes nodes
$ kubectl get nodes
NAME STATUS ROLES AGE VERSION
...
ip-172–20–38–193.ec2.internal Ready node 1d v1.11.6
...

# Get the EC2 instance ID
$ aws ec2 describe-instances --filters "Name=private-dns-name,Values=ip-172-20-38-193.ec2.internal" | grep InstanceId
"InstanceId": "i-0fdc6a4f95908a2ba",

# Restart the instance
$ aws ec2 reboot-instances --instance-ids=i-0fdc6a4f95908a2ba
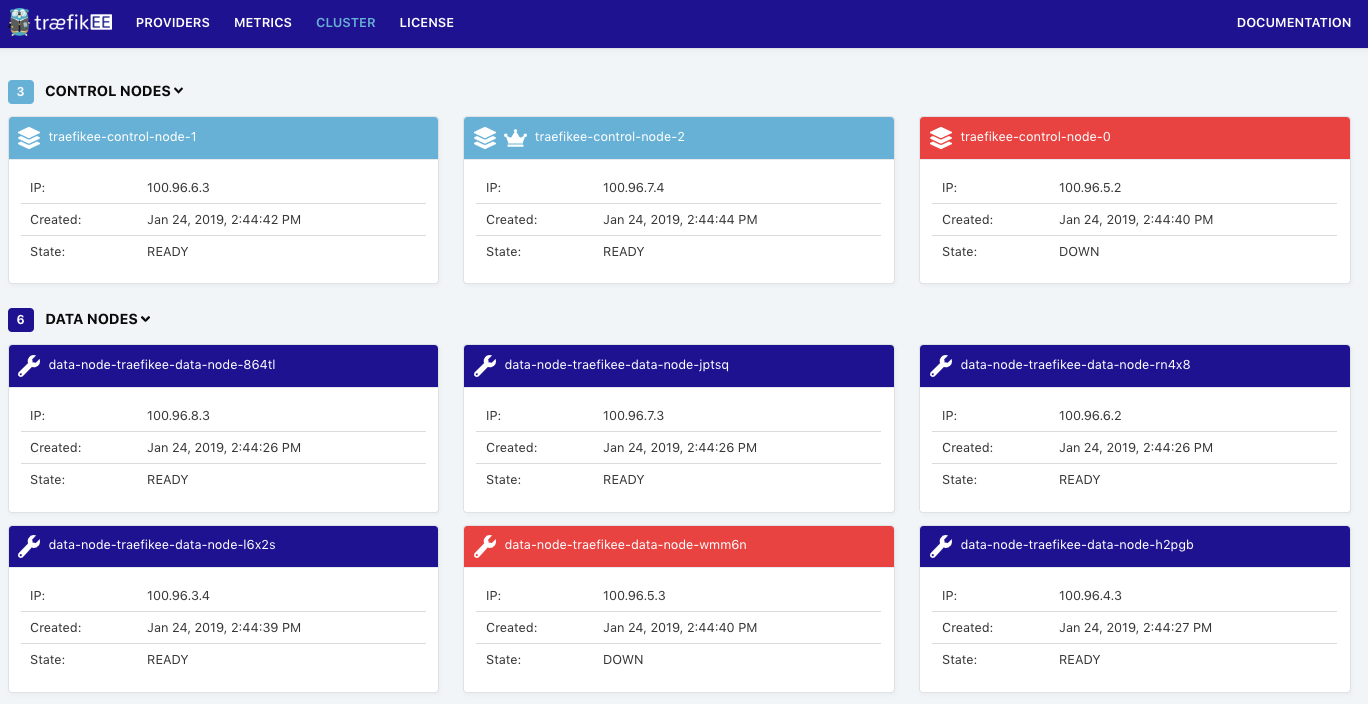
The Dashboard immediately reports that a control node and a data node are unhealthy ( traefikee-control-node-0 and data-node-traefikee-wmm6n in this case):
Validate High Availability
If you check back the load testing, you can see that no requests have been lost or in error. You might see, however, a punctual growth on the response time (+- 100ms):
sent: 25736 in-flight: 2 rate: 50/50 RPS responses: [200]: 25734As soon as the EC2 instance has restarted, all the failed nodes (Kubernetes and TraefikEE) are going back online:

Check this video of a the load test running with a worker node randomly killed:
That’s all for today! We demonstrated the high availability feature of TraefikEE. Oh, and don’t forget to clean your cluster:
kops delete cluster --name="${NAME}"On the next post “The Journey to Traefik Enterprise Edition: HTTPS for everyone”, we’ll focus on how to use TraefikEE with Let’s Encrypt to get HTTPS by default.


