Observing Kubernetes Ingress Traffic using Metrics

Enterprise engineering teams are continuously striving to deliver the best user facing experience possible for the applications they manage. Adopting Kubernetes (k8s) is helping in this regard by allowing organizations to easily manage lifecycle operations for workloads in a repeatable manner. Because of this, Kubernetes has been a key enabler towards accelerating implementation of purpose-specific services to meet business requirements. While k8s provides a strong foundation for stable operations, proactive measures must still be taken to avoid negative impacts including performance or functional issues. Monitoring Kubernetes ingress traffic is a critical part of an effective strategy for detecting and managing potential issues in real-time. In this article, we’ll discuss this topic including:
- Where to integrate in a Kubernetes system to obtain metrics
- How monitoring data can be stored effectively
- What visualization tools can be used to understand metrics data
Obtaining ingress traffic metrics
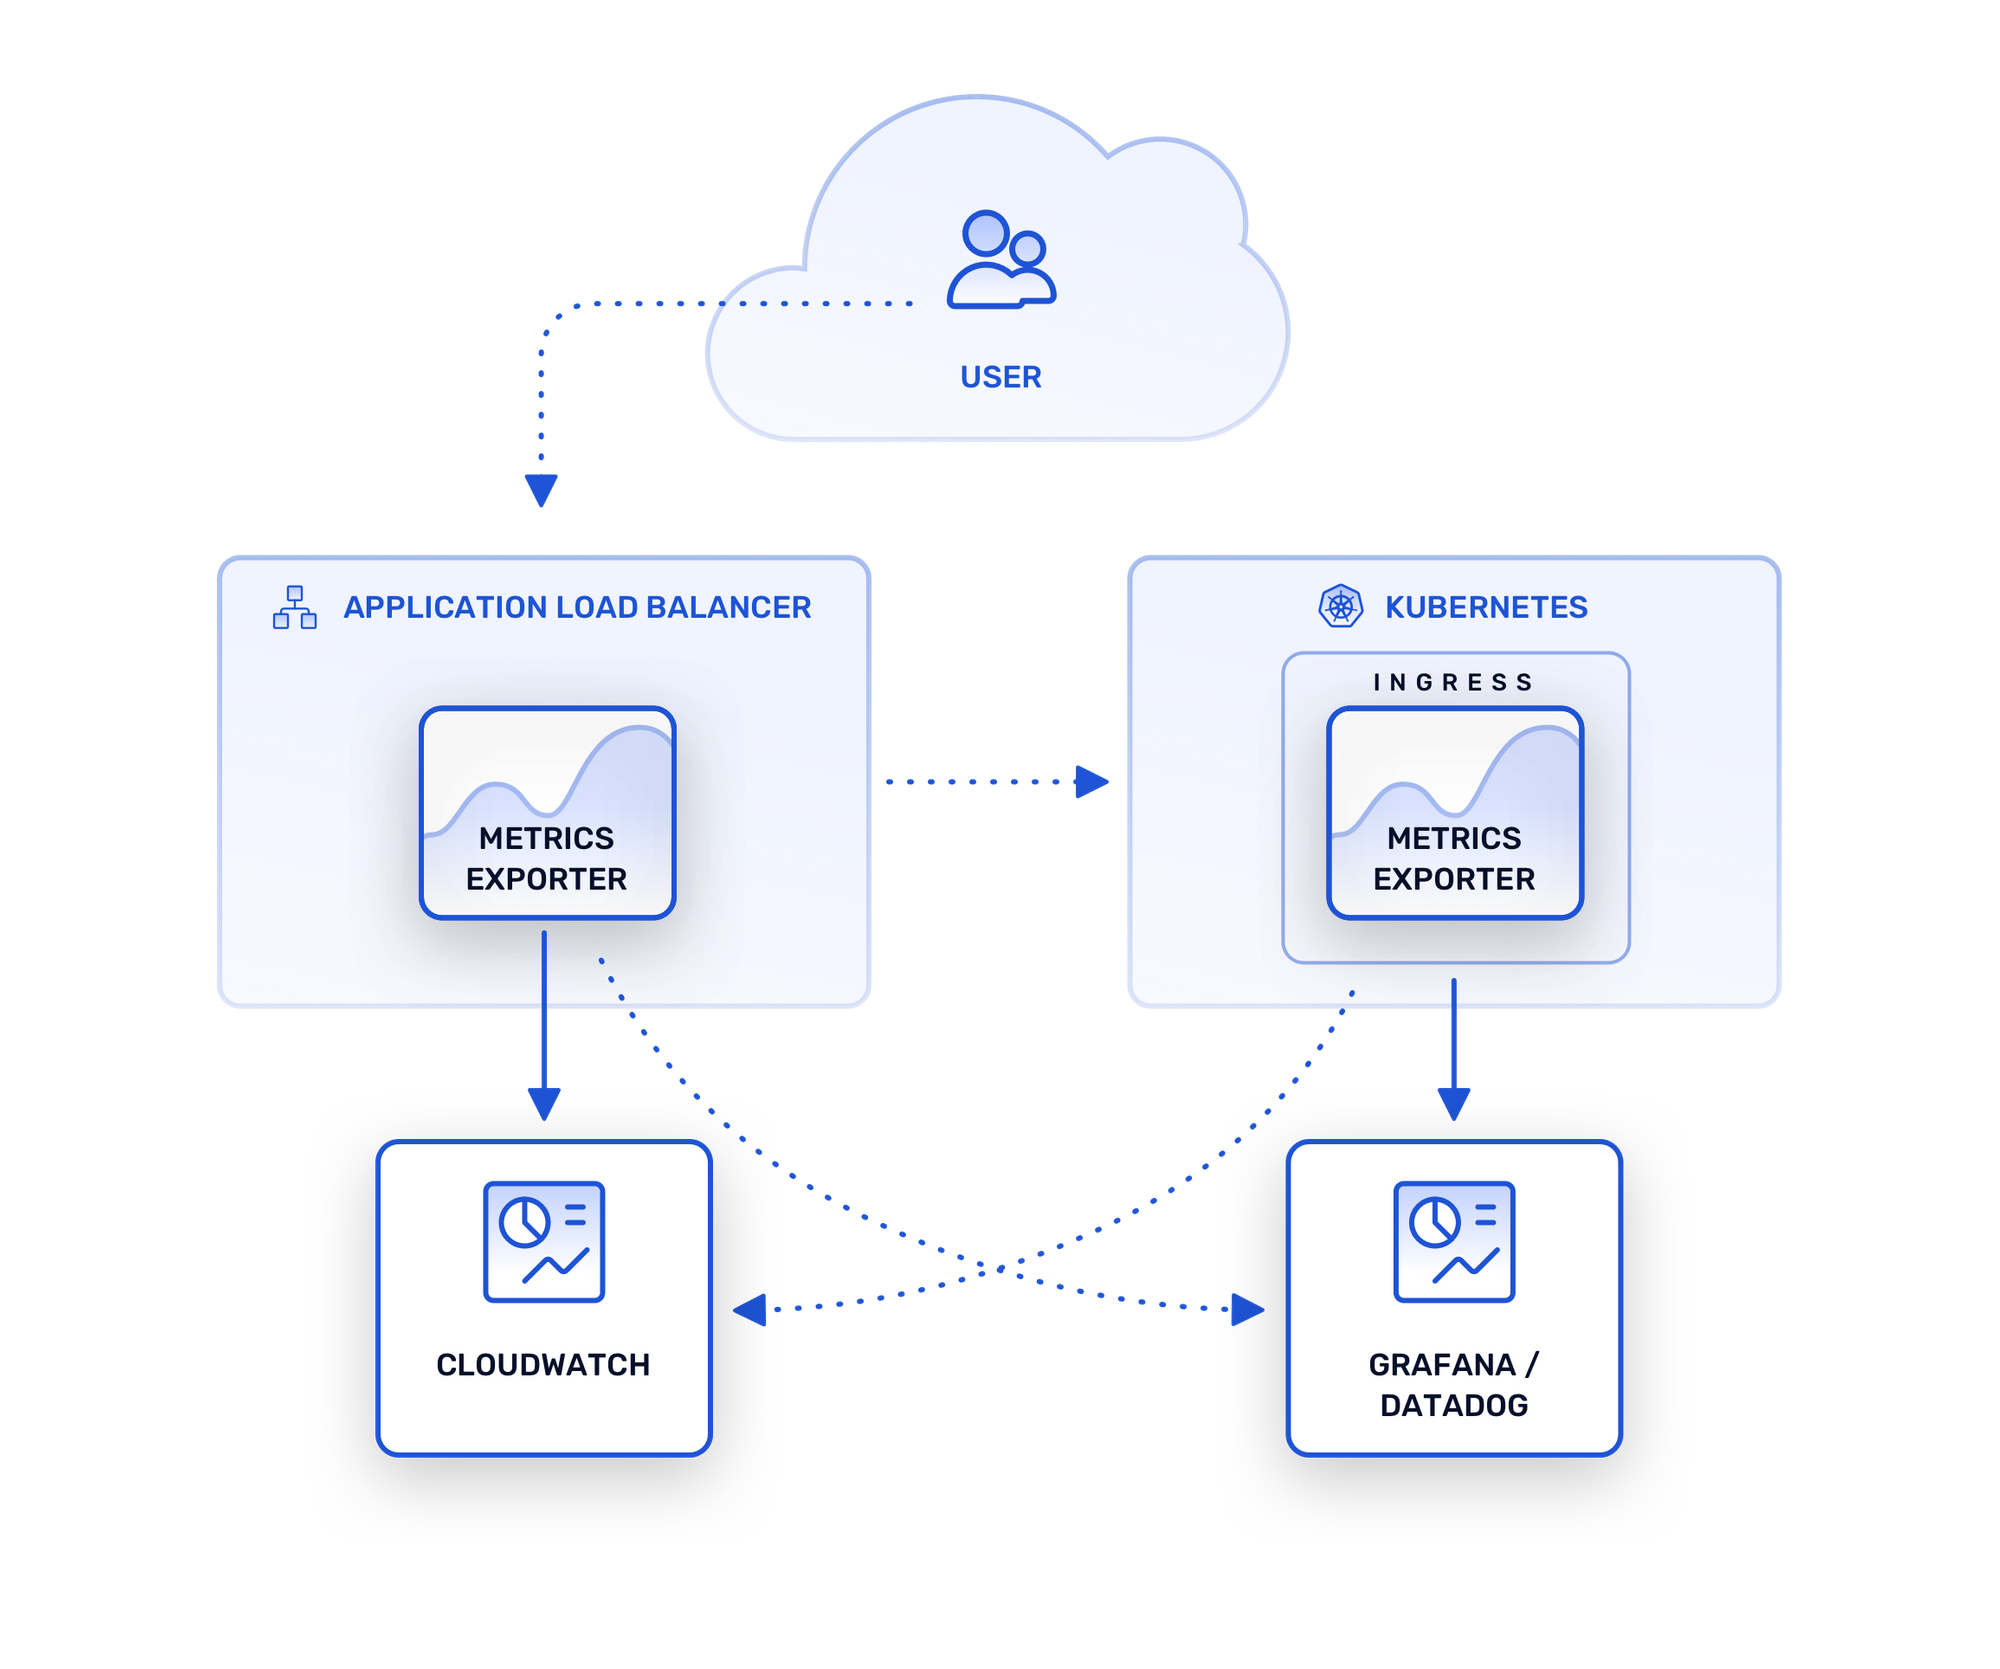
Where and how ingress traffic network statistics can be collected depends upon the adopted approach for exposing services. Let’s dive into the two strategies often used with Kubernetes:
- External Load Balancers
- Ingress Controllers
Metrics with External Load Balancers
When service configurations are defined appropriately by operators, Kubernetes can automate the deployment of managed load balancers. For example, when launched within AWS, a Kubernetes Service can instantiate a cloud load balancer instance without any out-of-band provisioning steps required by developers. The implementations of these load balancers are black boxes, but they all expose mechanisms for monitoring and tracing. In the case of AWS, time-series data and request logs can be collected and accessed using accompanying integrated services such as CloudWatch and CloudTrail. One potential drawback of these tightly integrated proprietary services is that these systems often do not integrate easily with external data storage and visualization tools.
Metrics with Ingress Controllers
When thinking about monitoring Ingress Controllers, it’s useful to keep in mind that they are implemented as standard Kubernetes applications. This means that any monitoring approaches adopted by organizations to track the health and liveliness of k8s workloads can be applied to Ingress Controllers. Tracking network traffic statistics in particular, however, requires taking advantage of controller-specific mechanisms. Similar to external load balancers, the specific metrics exposed vary depending on the controller, but any production quality implementation will provide built-in metric collection capabilities that can be integrated with an external data storage system.
Data storage for Ingress Monitoring
Selecting a data storage solution is an important part of defining a traffic monitoring architecture for Ingress Controllers. There are two general categories of implementations that one can choose between:
- Self-managed (typically open source) database systems
- Managed SaaS database systems.
While applications often use general-purpose SQL databases for their structured data, with monitoring data it’s advantageous to utilize a system optimized for storing and querying time-series data. There are multiple open source options for time-series databases, including InfluxDB and Prometheus, either is typically deployed in the same k8s cluster as the Ingress controller. Once these systems are provisioned, it’s just a matter of configuring settings for the Ingress controller to enable automated metric data collection in the database.
Some teams may prefer to take the route of a fully managed data provider to avoid the overheads of maintaining a database. There are options such as DataDog or Elasticsearch available that meet this demand in the form of a cloud-based SaaS monitoring platform. The providers are well supported by controller implementations due to their popularity, and Ingress controllers such as Traefik are designed to easily integrate with it.
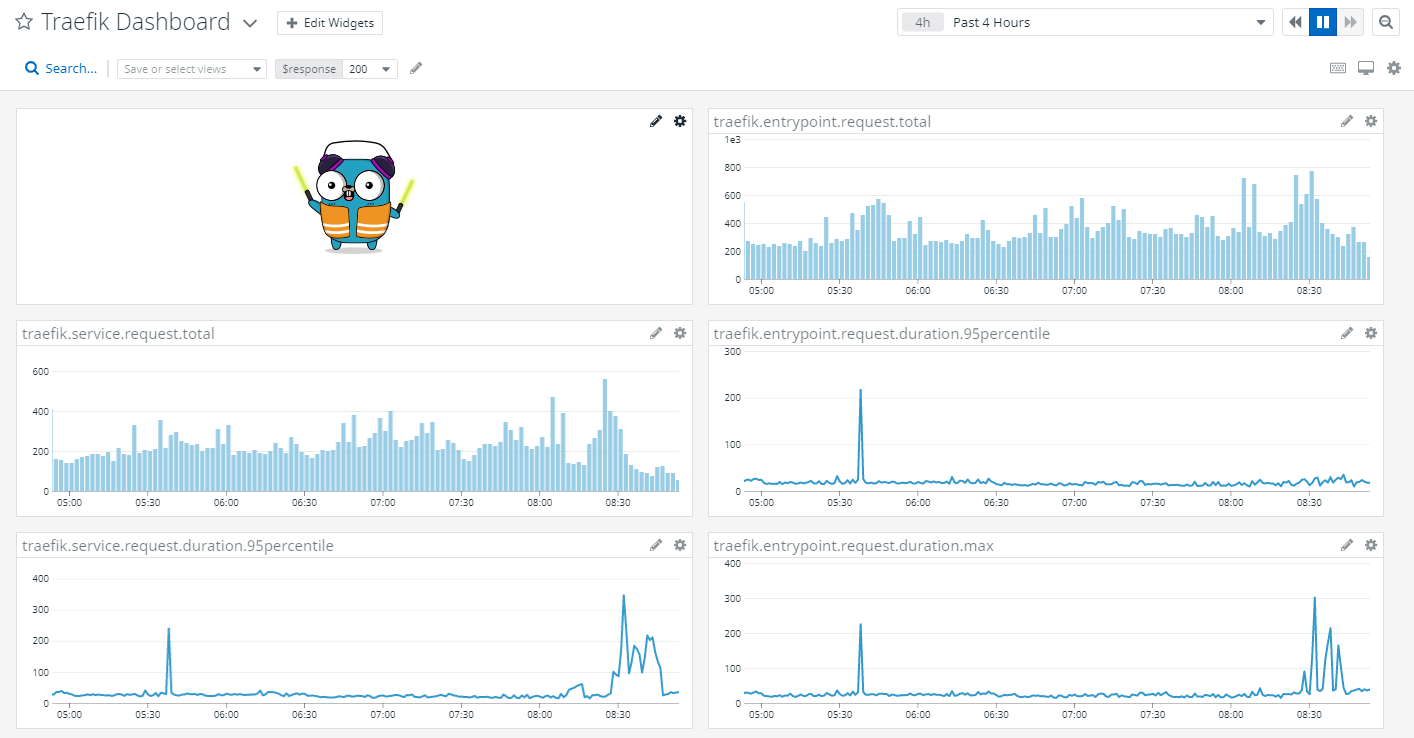
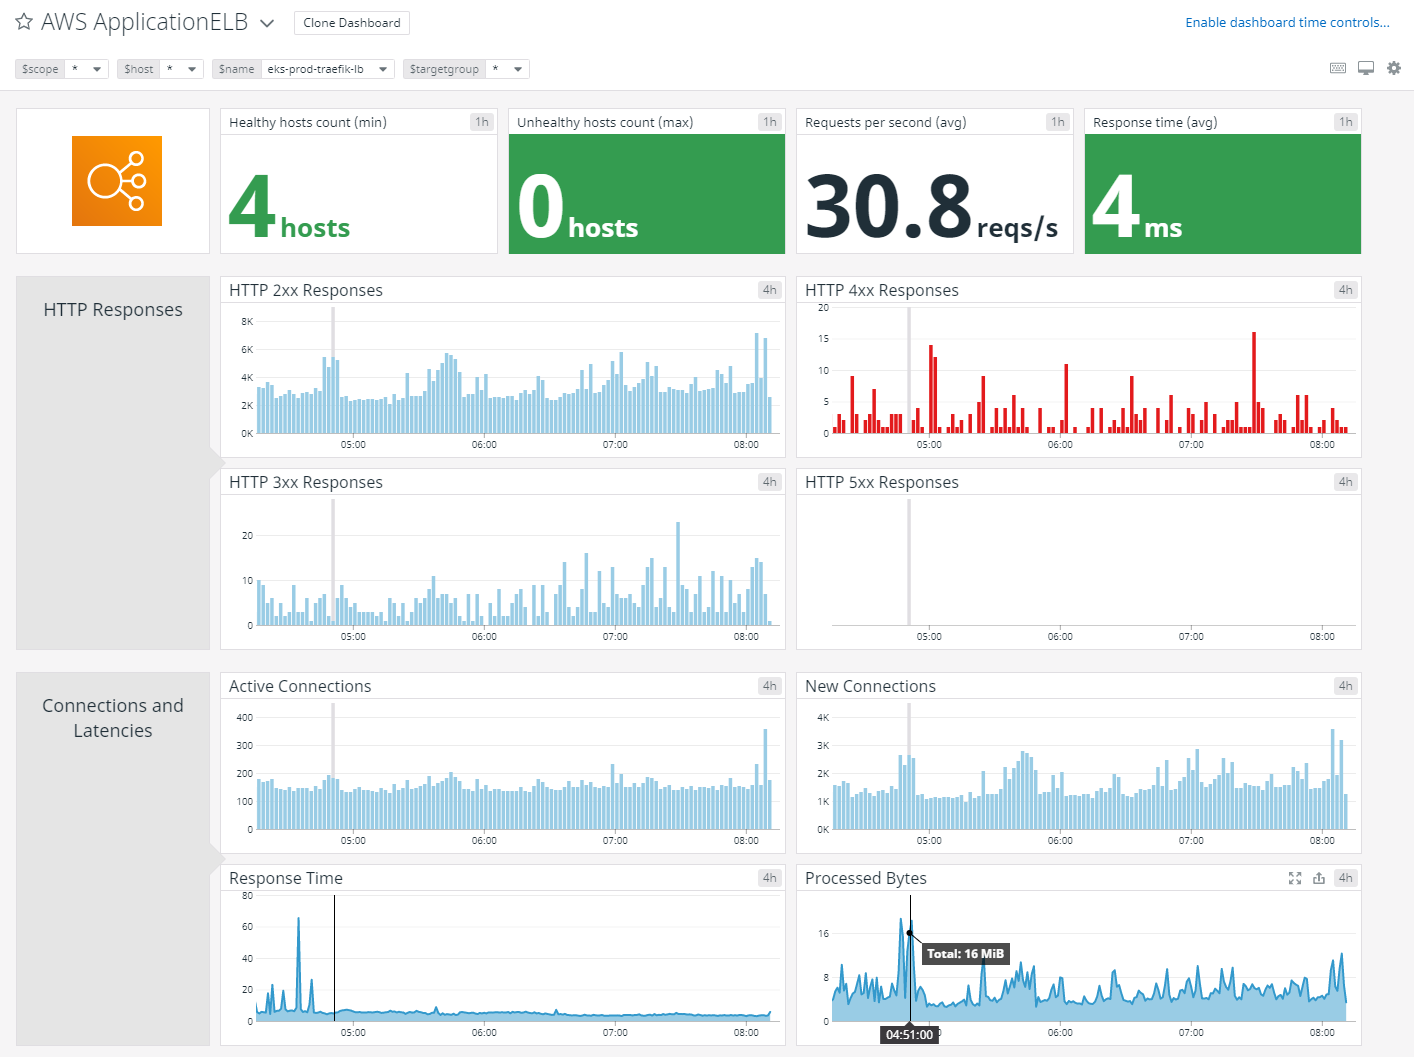
Visualizing Ingress Traffic Metrics
Getting metrics into a database is a first step towards effective ingress monitoring, but providing engineering teams with actionable information in real-time requires being able to easily interpret the information. Visualizing time-series data is the most effective way to convert raw metrics into human-digestible form. For example, visualizations are often combined into dashboards and used by Site Reliability Engineers to track the status of services and as an information source when live-site issues occur. Grafana is a widely adopted open source software for data visualization which works well with databases such as InfluxDB and Prometheus. Alternatively, the managed solutions mentioned earlier, such as DataDog, provide built-in visualization capabilities as part of their holistic platforms.
Summary
Monitoring ingress traffic is an important part of managing the health of external-facing services. As outlined in this article, best-of-breed metric storage and visualization technologies can be adopted for Kubernetes monitoring by virtue of capabilities provided by Ingress Controller implementations such as Traefik. This means organizations can easily rollout effective monitoring for k8s clusters providing peace of mind for engineering teams and end-users.
Furthermore, Traefik metrics and reporting are available through Traefik Enterprise and Traefik Pilot. You can sign up for a demo of Traefik Enterprise today, and Traefik Pilot is already available for users of the popular open source Traefik Proxy project.


