Monitor Your Production at a Glance With Traefik 3.0 and OpenTelemetry

Today, we’re continuing our blog series on Traefik v3 (checkout our previous posts on migration path from Traefik v3 and the Wasm support with Coraza WAF plugin). This article will focus on how to leverage OpenTelemetry in Traefik v3.
Monitoring and observability have always been a priority for Traefik, consistently following industry standards such as OpenTracing integration starting with Traefik v2. That's why incorporating OpenTelemetry, the latest emerging standard, into our toolkit was an easy decision.
How Observability Ensures Infrastructure Robustness
In the microservices era, monitoring and observability—with rich metrics, tracing, and logs—are fundamental necessities in order to maintain the reliability and efficiency of our systems.
Tracing allows you to track the flow of operations within your system. Using traces, and spans, you can identify performance bottlenecks and pinpoint applications causing slowdowns, so you can optimize response times effectively.
Logs provide real-time insight into the health of your system. It enables swift error detection and intervention through alerts. By centralizing logs, you streamline the debugging process during incident resolution (say goodbye to grep).
Metrics offer a comprehensive view of your infrastructure's health. They allow you to monitor critical indicators like incoming traffic volume. For instance, Traefik enables you to dynamically scale your infrastructure based on observed traffic patterns. Additionally, metrics graphs and visualizations are helpful during incident triage to understand the causes and implement proactive measures.
OpenTelemetry: One Standard to Rule Them All
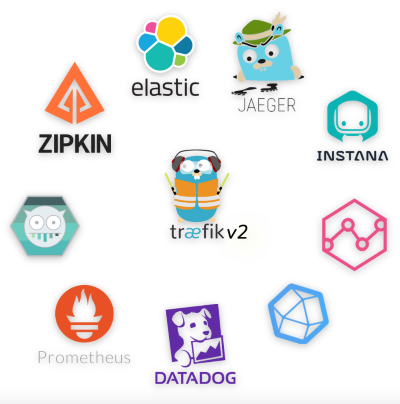
There are many tools in the market from a wide variety of vendors. Sifting through all the choices can be difficult, and picking the wrong one can be a huge pain as switching later is extremely cumbersome.
Part of what makes it difficult in deciding is because each vendor does things differently. Some scrape data, some pull it. Some are cloud-based, whereas others are on-premises. Switching between them is complex and time-consuming, if even feasible at all.
That's where OpenTelemetry comes in. It's a fusion of two older standards, OpenTracing and OpenCensus. OpenTracing focused on tracing, while OpenCensus focused on metrics and tracing. OpenTelemetry brings them together and adds logging specifications.
OpenTelemetry is an open-source project that belongs to the CNCF since 2019. Unlike with OpenTracing and OpenCensus, OpenTelemetry provides many implementations in different languages, like a Go SDK for example.
Open Telemetry makes life easier for everyone. For vendors and data providers like Traefik, having one standard obviously makes it simpler to support. For users, it ensures that the observability APIs will stay consistent regardless of the tools chosen.
OpenTelemetry in Traefik
While Traefik v2 supports many metrics and tracing vendors, it doesn’t support every solution in the market.
Now, with Traefik v3, we've made it possible to export metrics and traces in the OpenTelemetry format (logs support will be available as soon as the Go SDK is ready).
This allows us to ensure we support every OpenTelemetry consumer with no further implementation changes, making Traefik easy to integrate into your infrastructure.
To make sure we're fully compliant with the OpenTelemetry standard, Traefik adheres to the specified semantic conventions. These conventions tell us what data to provide based on what our software does in your setup.
Since Traefik Proxy is a reverse proxy, we've included metrics and spans information as expected in the OpenTelemetry framework.
Now, let's take a look at how easy it is to set up OpenTelemetry in Traefik.
How to install OpenTelemetry with Traefik v3?
Let's walk through the straightforward steps to install OpenTelemetry with Traefik.
OpenTelemetry Architecture
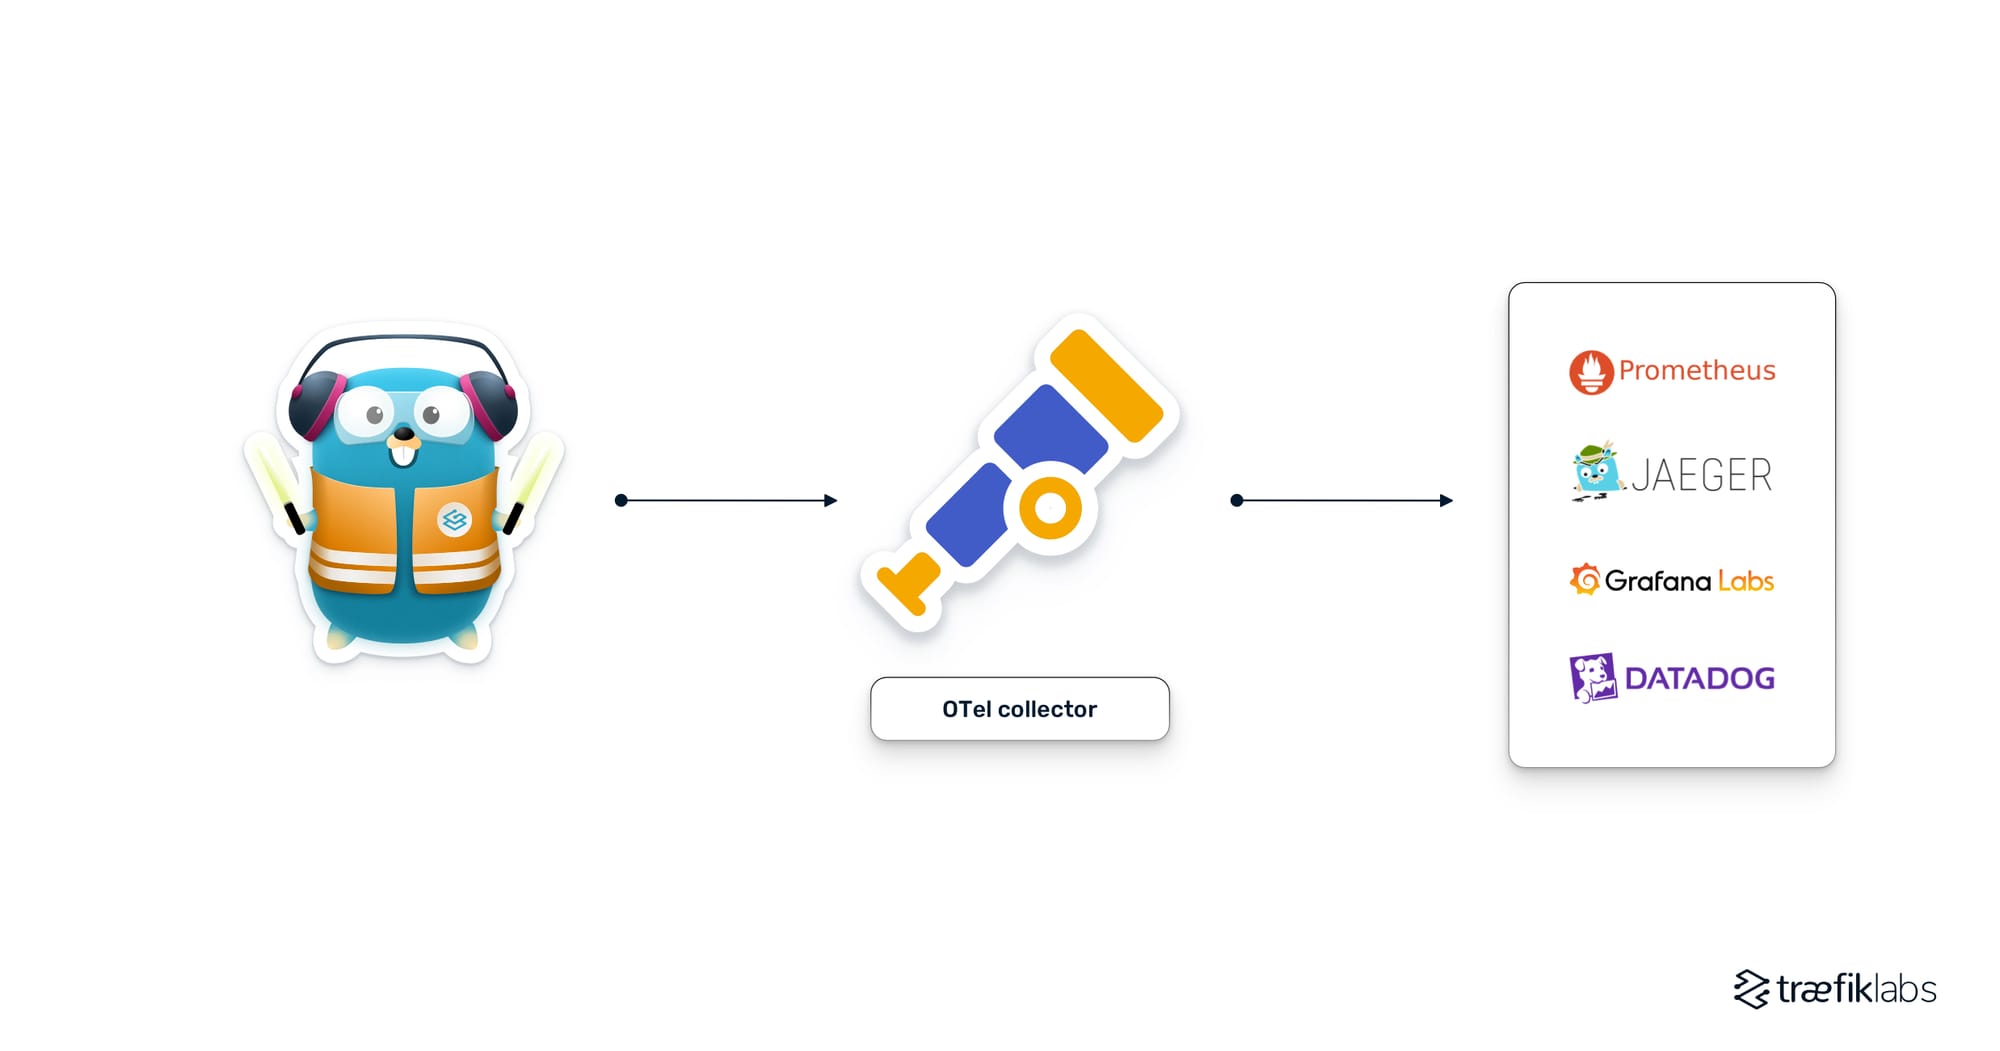
First off, it's worth noting there are two main ways to integrate Traefik (or any OpenTelemetry data provider) with an OpenTelemetry data consumer:
- Vendor Direct Access: Traefik can directly connect with a consumer-like Prometheus or Jaeger to send OpenTelemetry info. It's typically used for development purposes.
- OpenTelemetry Collector: This software acts as a middleman, importing data from Traefik, potentially transforming it, and then exporting it to the consumer. This approach offers centralized management of OpenTelemetry data, and scalability, and is the recommended method for handling OpenTelemetry information in large-scale applications.
Traefik v3 Configuration
Regardless of which method you choose, the cool thing is that the configuration stays the same.
First, you deploy the OpenTelemetry collector (or the solution you need) as well as Traefik on your cluster.
Then, you just set up the collector endpoints, and you're set. Whether you're adding a collector or switching up the consumer, all you have to do is tweak the address in the configuration as described below (check the documentation for more options):
## Traefik v3 ##
################

# Send metrics data to a Prometheus instance
metrics:
  otlp:
    http:
      endpoint: http://prometheus:9090/api/v1/otlp/v1/metrics

# Send tracing data to a Jaeger instance
tracing:
  otlp:
    http:
      endpoint: http://jaeger:4318/v1/traces
And that's it! Simple, right?
Traefik v2 Migration
While this setup works smoothly for users starting fresh with Traefik v3, what about those looking to migrate from Traefik v2?
Concerning the metrics, the good news is you can migrate seamlessly—i.e., the vendor-specific integration still works. But do not hesitate to migrate to OpenTelemetry when you’re ready for it!
However, if you've been using Traefik v2 for tracing, it's important to note that you may need to migrate to OpenTelemetry in Traefik v3. Maintaining both vendor-specific implementations and OpenTelemetry wasn't feasible, hence the decision to break backward compatibility.
Conclusion
As you have seen, integrating Traefik with OpenTelemetry couldn't be easier.
Sure, OpenTelemetry is relatively new and still evolving (with ongoing work on logs integration, expanding semantic conventions, and more), but it's promising and undoubtedly the best standard for monitoring and observability.
So, why wait? Dive in, give it a try, and don't forget to share your feedback to aid in refining our integration.
To learn more about v3, watch the recording of our recent Traefik v3 Online Meetup.
See you on GitHub.